Australian (ASX) Stock Market Forum

Dump it Here

look please at Newcrest, as it is doing thy head in.

The message was directed to @DrBourse
We all have differing opinions & I wish to throw up a chart that tells "me" a story as I know the Doctor is currently kicking back "cruising".

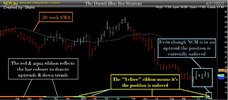
The Ducati Blue Bar Weekly Chart
1. The "Yellow" ribbon means the position is unloved
2. The "Aqua" bars mean the position is trending up
3. The "Red" bars mean the position is trending down
4. Even though NCM is in an uptrend the position is currently unloved
5. The red & aqua ribbon reflects the bar colours to denote uptrends & down trends
NCM.jpg


Summary
1. When a position is unloved there is not enough buying pressure to push the price higher.
2. Also, the dividend yield for NCM is "piss-poor", that's if you are investing for dividends.

Skate.
 
Last edited:
Trend following always looks easy
That’s because the principles are very simple. The secret to success is staying “focused”. Trend Trading creates its own unique set of "problems", problems that don't need to be solved but rather to be accepted.

Profitability
Comes from "selling the losers quickly" & knowing "when to sell the winners" is the secret to trading profitably no matter the style or system you elect to trade.

Skate.
Good morning Skate,

Nice comments, true that.

As time progressed and rcw1 got older and wiser ... knowing when to sell became easier, because selling to early no longer raised rcw1's heartbeat. Difficult thing to measure. How much profit you make over and above waiting for more profit from the sale of one stock, when the earlier lesser profit sale was used to leapfrog into other stocks and subsequently make incrementally more profit.... even before the initial stock had time to vastly increase in share price.

Very interesting really.


Kind regards
rcw1
 
The message was directed to @DrBourse
We all have differing opinions & I wish to throw up a chart that tells "me" a story as I know the Doctor is currently kicking back "cruising".

The Ducati Blue Bar Weekly Chart
1. The "Yellow" ribbon means the position is unloved
2. The "Aqua" bars mean the position is trending up
3. The "Red" bars mean the position is trending down
4. Even though NCM is in an uptrend the position is currently unloved
5. The red & aqua ribbon reflects the bar colours to denote uptrends & down trends

View attachment 148855


Summary
1. When a position is unloved there is not enough buying pressure to push the price higher.
2. Also, the dividend yield for NCM is "piss-poor", that's if you are investing for dividends.

Skate.
Nice work, thanks for that Skate.

Kind regards
rcw1
 
ZIgzag is a beautiful indicator, underused imo. Of course lookahead bias must always be considered, but that can be negotiated easily enough.

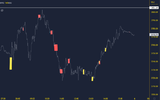
I have one coded for TV which highlights zigs that are particularly sharp in angle. Whoever is in charge of the price (bulls or bears) will tend to move the price more sharply (higher angle) in their favoured direction. Yellow is a sharp bullish angle, red the opposite. Similar to the "speed of tape" style of indicator.

If you think about it from the insto pov, it makes sense. When liquidity appears, you want to grab it quickly then return the price to roughly where it was so that no one notices. These can be seen as sharp angled moves.


x.png
 
ZIgzag is a beautiful indicator, underused imo. Of course lookahead bias must always be considered, but that can be negotiated easily enough.

Whenever someone mentions Zig Zag and building a trading system around it, i get a cup of coffee because i know it's going to be messy.

Summary
Do not trade using the ZigZag indicator.

The ZiGZag Indicator
Straight off the bat, I should say the ZigZag function is useful during the strategy development phase as it graphically presents the main trend with great clarity.

The ZigZag function
Should never be used in trading or backtesting as the signals keep repainting when more data is received. The repainting is due to the dynamic nature of this function, therefore, the backtest results can be highly misleading.

Beginners trap
It's important to remember when backtesting a strategy great care should be taken to exclude any revisable parameters ensuring the backtest results are valid & accurate.

One advantage of the ZigZag indicator
It can be used to graphically reveal the profit potential as a guide to how accurate your signal is in relationship to the pivot points.

Pure Gold
Every time I try to communicate with others I’m reminded of why I don’t do it often.

Skate.
 
@Skate I can see from your chart that your jumping onto the first sign of expansion but not hanging around for the inevitable contraction that follows.

The main advantage of "System Trading"
System trading is all about timing, & doing the right thing at the right time. The way to achieve this is by allowing traders the freedom to create their own rules & methods for (a) identifying, (b) buying, & (c) selling positions for maximum profit.

Traders can derive useful metrics to formulate trading rules
Traders use robust metrics to establish the rules to identify positions, & determining entry & exit conditions are extremely useful for identifying trending stocks that also help in predicting the reversal of a trend

Skate.
 
The ZiGZag Indicator
Straight off the bat, I should say the ZigZag function is useful during the strategy development phase as it graphically presents the main trend with great clarity.

The ZigZag function
Should never be used in trading or backtesting as the signals keep repainting when more data is received. The repainting is due to the dynamic nature of this function, therefore, the backtest results can be highly misleading.

Beginners trap
It's important to remember when backtesting a strategy great care should be taken to exclude any revisable parameters ensuring the backtest results are valid & accurate.

One advantage of the ZigZag indicator
It can be used to graphically reveal the profit potential as a guide to how accurate your signal is in relationship to the pivot points.

Pure Gold


Skate.

With a standard zz, I use a period of say 0.0001. The low period means it's just the same as ROC(C,1). If 5min is too choppy, just go up one or more timeframes. The advantage over ROC(C,1) is that it's easier to compare peaks and troughs for pattern ID, but always SetTradeDelay to (1,1,0,0) if you want to buy troughs and sell peaks. Backtesting is no problem this way.

Or use a custom zig zag that does not re-paint like https://www.tradingview.com/script/gY4ilk5N-Momentum-based-ZigZag-incl-QQE-NON-REPAINTING/

Easy way to assess if there's problems is to use 'bar replay' or AB's code check.
 
Or use a custom zig zag that does not re-paint.

@Gringotts Bank there is no ZigZag indicator that does not repaint due to the dynamic nature of this function. If you use this indicator whilst backtesting the results will be highly misleading & trading will be heartbreaking.

Validating Trends by Spyros Raftopoulos
Spyros Raftopoulos wrote a great article for the "Stocks & Commodity" magazine some years back where he described the problem of the dynamic last leg. In the "S&C" article he presented his version of the ZigZag indicator as a "ZigZag Validity Indicator", which he believes can be used to validate the last leg.

This "Stocks & Commodity" article introduces the "zigzag trend indicator"
Spyros believes his "zigzag trend indicator" handles the dynamic nature of the zigzag indicator more efficiently, something that I have not been able to replicate. Spyros believes his "zigzag trend approach" solves the validity problem of the dynamic last leg by incorporating zigzag into a clearly tradable indicator. This may be so, but I can't agree with him "at this stage" because in all of my research I can't validate this & "it's not for the want of trying".

The Zigzag Trend Indicator is a powerful noise filter
I can somewhat agree with this but it's not without its problems. Simply his technique incorporates the power of zigzag into a more valid indicator but IMHO it's still not tradable. The popularity & usefulness of the zigzag indicator never seems to die. I'm with @DaveDaGr8 on this one where he grabs a cup of coffee, I grab the popcorn because we both know it's going to be messy.

Skate.
 
Last edited:
@Gringotts Bank there is no ZigZag indicator that does not repaint due to the dynamic nature of this function. If you use this indicator whilst backtesting the results will be highly misleading & trading will be heartbreaking.

Validating Trends by Spyros Raftopoulos
Spyros Raftopoulos wrote a great article for the "Stocks & Commodity" magazine some years back where he described the problem of the dynamic last leg. In the "S&C" article he presented his version of the ZigZag indicator as a "ZigZag Validity Indicator", which he believes can be used to validate the last leg.

This "Stocks & Commodity" article introduces the "zigzag trend indicator"
Spyros believes his "zigzag trend indicator" handles the dynamic nature of the zigzag indicator more efficiently, something that I have not been able to replicate. Spyros believes his "zigzag trend approach" solves the validity problem of the dynamic last leg by incorporating zigzag into a clearly tradable indicator. This may be so, but I can agree with him "at this stage" because in all of my research I can't validate this & "it's not for the want of trying".

The Zigzag Trend Indicator is a powerful noise filter
I can somewhat agree with this but it's not without its problems. Simply his technique incorporates the power of zigzag into a more valid indicator but IMHO it's still not tradable. The popularity & usefulness of the zigzag indicator never seems to die. I'm with @DaveDaGr8 on this one where he grabs a cup of coffee, I grab the popcorn because we both know it's going to be messy.

Skate.
Did you read my post? I explained how it can be used safely with backtesting.
 
Did you read my post? I explained how it can be used safely with backtesting.

Yes, I did.

Opinions will differ
If you are happy using your method, kudos to you. All I'm saying is I don't agree & gave you a valid reason why. I also have great respect for Spyros Raftopoulos but from my extensive research I have found no value in his "ZigZag Validity Indicator". I went on to say "not to use his indicator" as a trading system where he indicates that you can.

Skate.
 
"ZigZag Validity Indicator"
Using additional indicators to confirm signals have merit but Spyros Raftopoulos's "ZigZag Validity Indicator" to "me" has limited value. As "system trading" is rules-based additional indicators can be used to identify trends, & confirm trends, to determine the timing of the entry, exit, & profit target points is a better use of your time. It is essential for every trader to be aware of the limitations of each indicator before using them in trading.

Trend confirming indicators
Although some indicators help identify a possible trade, it is likely to provide some false signals. That's why traders should use multiple indicators to confirm trends, & filter signals, thus reducing errors. Traders should also use stop loss & profit targets when trading. Doing so determines the risk-reward ratio before taking a trade which means there is a better chance of being profitable. Combining multiple trading systems is another of my favourites as it helps to reduce risk by building more robustness into the strategy.

Skate.
 
Yes, I did.

Opinions will differ
If you are happy using your method, kudos to you. All I'm saying is I don't agree & gave you a valid reason why. I also have great respect for Spyros Raftopoulos but from my extensive research I have found no value in his "ZigZag Validity Indicator". I went on to say "not to use his indicator" as a trading system where he indicates that you can.

Skate.
It's not about opinions though. In most cases, zz will look ahead. It's a simple matter of reducing the period, then using a tradedelay.

Takes 2 secs to test. Tell me if there's a problem. Note that AB code check will say it references future data, but there's no problem. You're simply buying 1 bar after a trough, and seeling 1 bar after a peak.

PositionSize = 10000;
pr = .00001;
zzHiLo = Zig( c, pr );
pk = zzHiLo>Ref(zzHiLo,-1) AND zzHiLo>Ref(zzHiLo,1);
tr = zzHiLo<Ref(zzHiLo,-1) AND zzHiLo<Ref(zzHiLo,1);
SetTradeDelays(1,1,0,0);
BuyPrice=SellPrice=C;
Buy = tr;
Sell = pk;
Plot(zzHiLo,"",colorgreen,styleLine);
SetChartOptions(0,chartShowArrows|chartShowDates);
_N(Title = StrFormat("{{NAME}} - {{INTERVAL}} {{DATE}} Open %g, Hi %g, Lo %g, Close %g (%.1f%%) \n{{VALUES}}", O, H, L, C, SelectedValue( ROC( C, 1 ) ) ));
SetChartBkColor(ParamColor("Background Color",ColorRGB(0,0,0)));
SetBarFillColor(IIf(C>O,ParamColor("Candle UP Color", ColorRGB(33,69,129)),IIf(C<=O,ParamColor("Candle Down Color", colorbrown),colorLightGrey)));
Plot(C,"",IIf(C>O,ParamColor("Wick UP Color", ColorRGB(128,128,192)),IIf(C<=O,ParamColor("Wick Down Color", colorbluegrey),colorLightGrey)),64,0,0,0,0);
 
Trading Trends
When trading trends it's not good enough to just establish if there is a trend or not. It's important to identify where you are in the trend and what is the strength of the trend. Also it's important to know the context of the trend.
 
It's not about opinions though. In most cases, zz will look ahead. It's a simple matter of reducing the period, then using a tradedelay.

Takes 2 secs to test. Tell me if there's a problem.

It's okay.

There is a multitude of other topics I would rather canvas
There are topics that interest me more.

Skate.
 
I thought I'd jump up onto the soapbox, nudge you to move over, grab your megaphone and rev up the crowd myself.

Now you want to use my soapbox as well
Unfortunately @DaveTrade there is no crowd. I have a multitude of ideas for future posts as I don't like to rehash or canvass something I have posted extensively previously.

I prefer to canvas new ideas or post about what interests others
I think it's a forgotten point, but when someone posts they are posting stuff they already know. That's why it's important for others to have their say. @Gringotts Bank prosecuted his case of how he takes advantage of the ZigZag function very well & I've given the other side to the discussion. No matter how much we banter it will not change our stance on the matter. Playing tennis with someone in this matter is not only tiresome but a waste of both our time & effort.

Skate.
 
I would prefer to post about topics of interest
I have a list of ideas that would make good reading but I firmly believe the enthusiasm has fizzled out. Simply the content matter in this thread is not what others want to read or participate in.

Off the top of my head
1. Behavioral mistakes when trading & what they are
2. Post about what Is an acceptable maximum drawdown
3. Why is the max drawdown metric so important In trading
4. How does combining multiple buy conditions in a strategy filter out false signals
5. Why does "Portfolio Construction" leads to more profitability
6. What Is The Holy Grail In Trading?
7. Why is the Sharpe Ratio a handy metric & what is it?
8. Why "Trading Strategies" don't work
9. How to know when trading strategy stops performing before it's too late
10. Which time frame is best for trading?
11. What is the best profitable method to trade - is it Day trading, Swing Trading, or Trend Trading
12. How reading books don't make you a smart trader
13. How do we go about being a smart trader
14. How to deal with trading biases
15. How do we overcome trading biases?

Summary

These are some ideas, but are they really worth canvassing?

Skate.
 

I would prefer to post about topics of interest
I have a list of ideas that would make good reading but I firmly believe the enthusiasm has fizzled out. Simply the content matter in this thread is not what others want to read or participate in.

Off the top of my head
1. Behavioral mistakes when trading & what they are
2. Post about what Is an acceptable maximum drawdown
3. Why is the max drawdown metric so important In trading
4. How does combining multiple buy conditions in a strategy filter out false signals
5. Why does "Portfolio Construction" leads to more profitability
6. What Is The Holy Grail In Trading?
7. Why is the Sharpe Ratio a handy metric & what is it?
8. Why "Trading Strategies" don't work
9. How to know when trading strategy stops performing before it's too late
10. Which time frame is best for trading?
11. What is the best profitable method to trade - is it Day trading, Swing Trading, or Trend Trading
12. How reading books don't make you a smart trader
13. How do we go about being a smart trader
14. How to deal with trading biases
15. How do we overcome trading biases?

Summary
These are some ideas, but are they really worth canvassing?

Skate.

For sure.

Highlighted are the topics I would take the other side on.

On any number of the others, I may or may not agree. We'll just have to wait and see.

jog on
duc
 
I firmly believe the enthusiasm has fizzled out
@Skate I think that the current market conditions have got something to do with this. People see traders struggling in these conditions and maybe start to think that it's all too hard for them to master. This can be a time to learn what needs to learnt in order to be ready for the next bull run.

One important thing for all traders is to know when it's safe for them to go into the water, do they have the skill to handle a big hard breaking surf or should they stick to calmer conditions until they are ready for the hard stuff.
 
Top