Australian (ASX) Stock Market Forum

Dump it Here

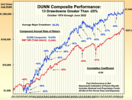
I'm as awake/asleep as Mr. Dunn (Dunn's system remains unchanged since 1975 - yet I hear the markets have changed due to a few recent events?): Dunn Equity Graph to 2022

But I'm certainly not playing (Play), unlike some....
Dunn's words (he may have a little more experience than some on this forum):

We only have two systems. The first system is the one I started with in 1974. The other system, we developed and launched in 1989. The major strategic elements of these two models—how and when to trade, how much to buy and sell—have never changed in almost 30 years. We expect change. None of the things that have happened in the development of new markets over the past 30 years strike us as making the marketplace different in any essential way. The markets are just the markets. I know that is unusual. I know in the past five years a lot of competitors have purposefully lowered the risk on their models i.e., they are deleveraging them or trying to mix them with other things to reduce the volatility. Of course, they have also reduced their returns.
Can you explain your Sharpe ratio comment in your subtext thing please? Sounds interesting.
 
We only have two systems. The first system is the one I started with in 1974. The other system, we developed and launched in 1989. The major strategic elements of these two models—how and when to trade, how much to buy and sell—have never changed in almost 30 years. We expect change. None of the things that have happened in the development of new markets over the past 30 years strike us as making the marketplace different in any essential way. The markets are just the markets. I know that is unusual. I know in the past five years a lot of competitors have purposefully lowered the risk on their models i.e., they are deleveraging them or trying to mix them with other things to reduce the volatility. Of course, they have also reduced their returns.
Nice quote. Dunn is doing very well this year. It has been a very, very, good year for trend followers.

One thing, though, Dunn has plenty of funds. For me as a small(ish) trader it is very important to stick within risk limits, otherwise I'd be looking for someone to donate their shirt.

KH
 
One of the toughest years to make money, so far this year. Got out with a couple of bear market rallies with small profits luckily on some positions. The rest are losses, in some cases bigger than planned with gap downs with no buyers to sell into i.e. thin liquidity ! Just sold another losing trade today in the Speculative Stock Portfolio, which I will update later.

It's been horrible this year with buy and hold strategies, i.e. longer term portfolio, so I won't even go there :depressed:
 
Can you explain your Sharpe ratio comment in your subtext thing please? Sounds interesting.
Almost all investors (retail in particular) are unable/unwilling to experience any investment pain (draw-downs/losses).

Most investment managers cater to these strong loss aversions (in order to receive sufficient funding) - hence, deploying low-risk/low-return strategies (aiming for high sharpe-ratios).

Funds (strategies) with high past sharpe-ratios are rewarded, funds (strategies) with low current sharpe-ratios are punished (i.e. sharpe-ratio chasing).

This results in a huge market opportunity in the financial eco-system, for those able/willing to experience investment pain (draw-downs/losses) - reward being overall market outperfomance.

Thus, thanks to all the high sharpe-ratio chasers, I'm set to retire when I turn 40...

(****Sharpe-ratio stated above is based on risk-free rate of return****)
It is definitive clear you are below 40 indeed.so 15y experience in a perma bull market and i assume in Australia so a perma bull country during that time.
So i can assume you have a great system in a perma bull market in a perma bull country.
Anyway, good on you i do not pretend i have anything like that

I started trading in 2008.... went as well as expected.

Perma bull indeed when looking at the index, but the index itself is a trading system which will only go higher in the long term (stock selection is based on relative market-cap strength, rather than absolute price strength).

Also one of the reasons why I based my system's back-testing on long term data-sets (lots of market events included in the 1992-now AUS dataset).
Well Done!
XYZ Yacht.GIF
 
Almost all investors (retail in particular) are unable/unwilling to experience any investment pain (draw-downs/losses).

Most investment managers cater to these strong loss aversions (in order to receive sufficient funding) - hence, deploying low-risk/low-return strategies (aiming for high sharpe-ratios).

Funds (strategies) with high past sharpe-ratios are rewarded, funds (strategies) with low current sharpe-ratios are punished (i.e. sharpe-ratio chasing).

This results in a huge market opportunity in the financial eco-system, for those able/willing to experience investment pain (draw-downs/losses) - reward being overall market outperfomance.

Thus, thanks to all the high sharpe-ratio chasers, I'm set to retire when I turn 40...

(****Sharpe-ratio stated above is based on risk-free rate of return****)
The way I interpret this is that you create strategies and optimize for % return rather than smoothness (like most of us). And that the set ups relate to functions of the market that occur when the Sharpsters are out of the market. Thanks, it's worth thinking about. Although I have no idea how it might work. Any clues?
 
The way I interpret this is that you create strategies and optimize for % return rather than smoothness (like most of us). And that the set ups relate to functions of the market that occur when the Sharpsters are out of the market. Thanks, it's worth thinking about. Although I have no idea how it might work. Any clues?

Trading hard to follow systems = less competition. All of us have to find our little spot in the eco-system.

(Be like the snake, watching all those tax/effort inefficient day traders etc...)
 
1. Almost all investors (retail in particular) are unable/unwilling to experience any investment pain (draw-downs/losses).

2. Most investment managers cater to these strong loss aversions (in order to receive sufficient funding) - hence, deploying low-risk/low-return strategies (aiming for high sharpe-ratios).

3. Funds (strategies) with high past sharpe-ratios are rewarded, funds (strategies) with low current sharpe-ratios are punished (i.e. sharpe-ratio chasing).

4. This results in a huge market opportunity in the financial eco-system, for those able/willing to experience investment pain (draw-downs/losses) - reward being overall market outperfomance.

5. Thus, thanks to all the high sharpe-ratio chasers, I'm set to retire when I turn 40...

(****Sharpe-ratio stated above is based on risk-free rate of return****)

Mr Trend;

Interesting post.

1. I would agree. Probably with good reason. To endure a 'price' drawdown you would have to be pretty confident that your investment/trading thesis had merit/legs to make you whole and eventually profitable. The number of significant drawdowns in his system are staggering.

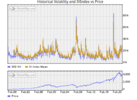
2. 'Most'. Probably agree. But what is 'low risk' and how do they measure risk? If you are employing a Sharpe Ratio, there are 2 issues: (a) risk is defined as volatility and (b) the standard deviation part of the calculation implies price is normally distributed. Both of course are false.

As to volatility and normal distribution:

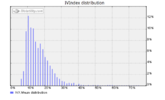
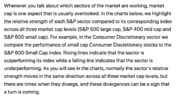
Screen Shot 2022-10-20 at 7.29.39 AM.pngScreen Shot 2022-10-20 at 7.29.49 AM.png
Risk of individual stocks as opposed to an index, say DIA, is very different. If you are buying an ETF (index) then I agree that you are actually coming far closer to defining risk as a function of volatility (closer but still not 100%) and therefore a mechanical backtest (could) have validity in its conclusions. With individual stocks forming your own individualised portfolio, this would be theoretically incorrect. It may work out in practice. That would be good luck.

3. That could be true. Is there data to support the assertion?

4. And here we come to the crux of the matter. The assumed risk free return is far from risk free. In fact it is being crushed as we speak. The macro-environment is fundamentally different from when this chap started his testing:

Screen Shot 2022-10-20 at 7.52.29 AM.pngScreen Shot 2022-10-20 at 7.53.11 AM.png

Which potentially will change significantly the way his system will perform. Now I accept I don't know his methodology, but we are truly in a 'this time is different' environment and markets are going to be different moving forward.

Clearly the 'risk' being traded here is not volatility. It is something else. Which is fine as long as you can identify or are told what that risk is. To manage risk, you must be able to identify that risk.

An issue with Mr Dunn's system is that drawdowns are steep and very common. How can you tell if the system is broken? If you can tell, just how deep of a drawdown would you be in at that point? If you can't, is that not a risk that is un-managed?

With such a low correlation (-0.04) are stocks the only asset class included or is that a function of the actual strategy?

Hopefully you can elucidate on some of this without necessarily giving away your secret sauce!

Screen Shot 2022-10-20 at 7.55.28 AM.png

jog on
duc
 
Observations from (CNBC & CNN)
Paul Tudor Jones recently said: "It's so hard to take what we've learned from investing for the past 12 years & put it behind you, but you really have to. The market changes. It's a completely different environment we're in right now".

Back in March 2020, the world shut down because of Covid-19
Those bored & stuck at home, turned to the markets as a source of entertainment while others attempted to fix their money worries. Using the stimulus money & taking advantage of new technology they entered the markets riding the wave of enthusiasm.

New market participants are cashing out
The initial enthusiasm started to waver in 2021. As a bear market prevailed during the second half of 2021 with increasing inflation & the onset of higher living costs, have been gradually leaving the markets.

Some traders have had enough
There have been some traders who have finally decided that they've had enough, pulling up stakes & moving on. Those once eager to buy the dip are now fleeing the markets with steep declines in activity over the past three months. Even those traders who have gradually been going to cash have added to the market downturn this year.

It's not panic stations yet
A loss of traders is concerning as it could spell a longer, deeper market downturn with higher volatility. Admittedly there are some pulling out of the market, but there are others rotating into more stable, dividend-paying stocks keeping some of the new money in the markets.

Skate.
 
Old mate Nick Radge , too , has been fearless in his honesty. More power to him for that.
That six figure number with a minus sign in front of it, just turns my stomach over.

Looking at that minus figure makes me shiver
@dyna, I'm with you on this one & that's why I made a few comments in this thread in relation to those experiencing ongoing constant losses. I'm not telling anyone how to suck eggs, rather my comments were aimed at those who find themself in any stressful situation when trading.

There is always a solution when trading gets out of your control
The first solution to consider is to stop trading & reassess the issue. It's always better to respond to stress rather than react when trading. Responding gives you time to think.

If you find yourself in a hole, the first thing to do is stop digging.

There are some brave souls who are "proud of their ability" to suffer great monetary pains while they wait for their convictions to be rewarded.

If you can't see the problem, there is no answer.

Skate.
 
An issue with Mr Dunn's system is that drawdowns are steep and very common. How can you tell if the system is broken? If you can tell, just how deep of a drawdown would you be in at that point? If you can't, is that not a risk that is un-managed?

@ducati916 makes some valid observations about "Dunn's Performance" since 1970
First off, I should say the rate of return is impressive & even more impressive knowing the average return of 16.63% has been achieved over a long period of time.

Compounded returns
When "compound returns" are touted & proudly displayed, I tend to switch off. I should also say, I couldn't stomach his equity curve & I believe the majority couldn't either.

How can you tell if the system is broken?
The Duc is opening a segue for another topic in my opinion. For me, the answer to this question is pretty simple, "you only realise a system is broken" when it's too late.

How do you know when the market conditions have changed?
As a system trader, it's our responsibility to keep in sync with the markets, doing so allows us to capitalise on what most don't. Allowing losses to accumulate, is certainly not the solution IMHO.

Skate.

Before we even get to a 'change' in the market:

Screen Shot 2022-10-22 at 4.42.13 PM.png

This statement really requires some thought.

(a) the index itself is a trading system; and
(b) which only goes higher in the long term; and
(c) with the reason given as : stock selection based on relative market-cap strength, rather than absolute price strength.

(a):Screen Shot 2022-10-22 at 4.53.28 PM.png

Screen Shot 2022-10-22 at 4.55.05 PM.png

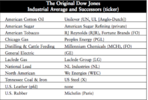
So indices replace members on a fairly regular basis, making an index a 'trading system'.

(b) only goes up

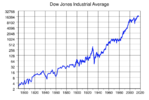
Screen Shot 2022-10-22 at 4.59.37 PM.png

So far, so good.


jog on
duc
 
Perma bull indeed when looking at the index, but the index itself is a trading system which will only go higher in the long term (stock selection is based on relative market-cap strength, rather than absolute price strength).

Interesting comment
Stock selection based on "relative market-cap strength". There must be something in this as @Trendnomics reported that his trading has not been affected in the last few years using this method of trading.

Further reading here

All of us have to find our little spot in the eco-system.

I would love to hear more
Explaining how to find that sweet spot would make an interesting read.

This statement really requires some thought.

Stock selection is based on relative market-cap strength
In answering @Gringotts Bank, @Trendnomics made this statement & I was expecting follow-up questions in this regard. As this is an educational thread of sorts a fuller explanation of how you go about trend trading using this method would be a great topic in itself. I'm a bit lost for words as it's all about "price action" for me.

Skate.
 
Hopefully, someone will post
There are those (forum members) who would trade Nick's WTT Turnkey Strategy. I'm hoping that a backtest will be posted for a direct comparison.

Backtest Details
$100k portfolio with a backtest period from 1/7/2019 to 30th June 2022.

My previous best effort
The previous best effort of backtesting the WTT Strategy was acceptable. To be truthful, it was a struggle to improve on the previous results.

With a little bit more time
There were areas for improvement. I'll post my previous best effort then I'll post the backtest for my final version of Nick's WTT Strategy.

View attachment 143663


Now my "Final Version" of Nick's WTT Strategy
Improvements were hard to find in the final version. The next capture below this one is a side-by-side comparison between the two strategies with red highlights.

View attachment 143664


Side-by-side comparison
The upgraded version of Nick's WTT Strategy with a direct comparison to my previous best version. The upload unfortunately is a little smaller making it hard to read.

There are improvements
Not only with the Net Profit, but also increased winners. reduction in the number of trades, lower drawdown, & better Car/MDD metric. The improvements came from adding my "Ulcer Index Indicator" to the buy condition, & passing on those riskier trades.

View attachment 143665


What is the Ulcer Index Indicator?
The Ulcer Index Indicator attempts to estimate the “stress” of a position by estimating price retracements. The indicator is based on the notion that downward volatility is bad, but upward volatility is quite good. It increases in value as the price moves farther away from a recent high price & also falls as the price rises to new highs. I hope my explanation of how I use the "Ulcer Indicator" helps you better understand why some traders are luckier than others. Indicators play a big part in my trading & they have certainly helped me. The Ulcer Indicator's sole purpose is to control the drawdown risk (not eliminate the risk) without reducing the profit potential of a strategy.

Metrics
Two areas of a backtest that carry more weight for me in deciding whether to keep developing a system, a system that you could trust trading live. (1) "Maximum System Drawdown percentage" & (2) the "Ulcer Index". Both should be low. A low drawdown & low Ulcer index should go hand in glove to give you the confidence to trade the strategy. I've previously explained how I take advantage of the Ulcer Index Indicator even supplying the parameters that I elect to use.

Finally
# I can now put this exercise to bed.

Skate.
Hi Skate. Could I trouble you to share the code for your "Final Version" of Nick's WTT Strategy?
 
Hi Skate. Could I trouble you to share the code for your "Final Version" of Nick's WTT Strategy?

Hi, @MurariMikeTrader welcome to our community
Thank you for making your first post in this thread, minutes after joining. Over time I have made a series of posts on a 20-period breakout-out strategy commonly referred to as the "WTT Strategy".

To save me from posting repetitive information again
Use the search feature (RH Top corner of the menu bar) & you will find approximately 140 posts using the WTT keyword. I'm sure reading a few of my posts will answer questions you have about the strategy.

Search Function.jpg

Enjoy looking around
If a thread interests you, read it slowly, don't fall into the trap of "speed reading" as it doesn't give you time to fully understand the post let alone the time to memorise all the important stuff. Also, make the search feature your best friend as "if you can think of a question", I'm sure it has already been answered.

Skate.
 
Interesting comment
Stock selection based on "relative market-cap strength". There must be something in this as @Trendnomics reported that his trading has not been affected in the last few years using this method of trading.

Further reading here


I would love to hear more
Explaining how to find that sweet spot would make an interesting read.


Stock selection is based on relative market-cap strength
In answering @Gringotts Bank, @Trendnomics made this statement & I was expecting follow-up questions in this regard. As this is an educational thread of sorts a fuller explanation of how you go about trend trading using this method would be a great topic in itself. I'm a bit lost for words as it's all about "price action" for me.

Skate.

So from @Skate

Screen Shot 2022-10-22 at 6.57.03 PM.png

So a little look:

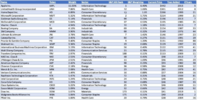
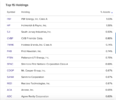
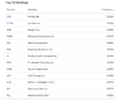
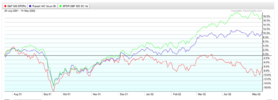
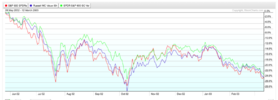
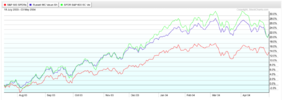
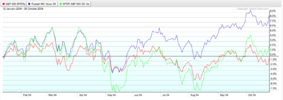
Screen Shot 2022-10-22 at 6.51.00 PM.pngScreen Shot 2022-10-22 at 6.50.44 PM.pngScreen Shot 2022-10-22 at 6.51.49 PM.pngScreen Shot 2022-10-22 at 6.52.05 PM.pngScreen Shot 2022-10-22 at 6.55.14 PM.pngScreen Shot 2022-10-22 at 6.55.50 PM.pngScreen Shot 2022-10-22 at 6.56.25 PM.pngScreen Shot 2022-10-22 at 6.56.45 PM.png

There are far too many to post them all, but you get the gist.

Today there are so many ETFs available, you could build a selection based on market cap/sectors quite easily.

The last question can at least now be asked and answered with a little more accuracy.

Has the market fundamentally changed? And if so in what time frames?

jog on
duc
 
What Investor Sentiment Means for Markets Going into 2023
Ken Fisher from Fisher Investments, Founder, Executive Chairman, & Co-Chief Investment Officer discusses how investor sentiment may affect markets in 2023. Ken believes today’s pervasive negative investor sentiment isn’t indicative of a world falling apart, but instead consistent with a world that’s already seen a market bottom & is very likely a precursor to higher stock prices ahead.

Warren Buffett once said
That it is wise for investors to be “fearful when others are greedy, & greedy when others are fearful.” Deeply negative sentiment, stoked by doom-and-gloom headlines about Russia-Ukraine, stubbornly high inflation & potential recession, is one of the most bullish features for investors, according to Ken.

Ken Fisher has a knack for making sense of market conditions
As one said "I always feel better & a little smarter after listening to Ken. When Ken speaks, I listen.


Skate.
 
Top