Australian (ASX) Stock Market Forum

Dump it Here

It pays to read what others think

Are there any clues when you should enter? It's all in the timing
@ducati916 is a regular contributor to this thread & one of his posts gave me the idea to create a simple visual strategy to see the results behind his words.

The simplicity of this strategy
"The Ducati Blue Bar Strategy", colours the bars (no matter the periodicity) in real-time telling you what to do next. We have all at one stage sung along to the bouncing ball above the words making it easy to say in tune. Well, it's the same way with this strategy. Put four traders in a room together & they will all have their reason why they "enter & exit" a position. Put four "system traders" in another room & their reasoning behind why they enter a trade can be just as dramatic & diverse.

Trading is a basic process
We all tend to overthink trading but when you strip back trading to the bare basics it's all about trading the price differential, catching trends, knowing when to get in & more importantly when to get out. Money management takes care of the rest. I'm not a fancy trader, I jump on confirmed trends & hop off in a timely manner looking for the next ride.

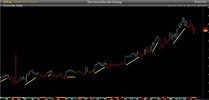
A coloured chart for Coles Group (COL)
Are there any clues when you should enter? yes, it is as simple as following the bouncing ball or in this case the colour of the bars. If you are like me you won't know where the next bar will go but the strategy does. Even when the chart doesn't have any signals you buy blue bars & sell red bars. I should also say, the first blue bar is the signal bar the next bar is the entry bar. It's the same with the red bars, the first is the signal bar the next is the exit bar.
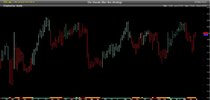
COL Timing.jpg


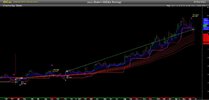
Marked chart for Coles Group (COL)
Now with the colors marked to show the progress of the bars
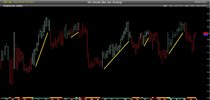
COL MARKED Timing.jpg


Skate.
 
Is there a way we can profit from Macquarie's positions displayed below?
I think there is a way to produce better than average returns. (Buy the blue bars & Sell the red bars)
  • Consumer Staples: Coles Group (ASX:COL)
  • Infrastructure: Transurban (ASX:TCL)
  • Healthcare: CSL (ASX:CSL)
  • Gold: Newcrest Mining (ASX:NCM)
  • Food: Graincorp (ASX:GNC)

# Coles Group (ASX:COL)

COL MARKED Timing.jpg


# Transurban (ASX:TCL)

TCL Timing.jpg


# CSL (ASX:CSL)

CSL Timing.jpg


# Newcrest Mining (ASX:NCM)

NCM Timing.jpg


Graincorp (ASX:GNC)

GNC Timing.jpg


For full disclosure

Guppies Multiple Moving Average (GMMA) is also a handy strategy.

5. GNC Timing.jpg


END clean images (3).jpg


Skate.
 
Came across below video - Is there any merit to primarily using CCI Indicator for determining trend along with entry/exit ?

 
Came across below video - Is there any merit to primarily using CCI Indicator for determining trend along with entry/exit ?


@Telamelo I've seen many video's showing how an indicator can be used, what they don't show you is how often it works or how often it doesn't work. You may be able to create a trading system using this one indicator but it would have to be tested in different market environments to prove it works and that it was a system that you would choose to trade. Maybe if you came up with some trading rules then one of the members with backtesting software might do a test for you.
 
Is there any merit to primarily using CCI Indicator for determining trend along with entry/exit ?

@Telamelo I must admit I have not viewed the video yet but I have made umpteen posts about how to use the CCI indicator & even explained its use & the Amibroker code that forms part of the CAM Strategy. To save posting again if you are interested in what I have to say about this indicator do a search. Use the keyword [CCI] or [CAM Strategy] by [Skate].

The (CCI) momentum oscillator identifies cyclical trends
The issue that most traders have using the CCI momentum oscillator is that they believe it displays "excessive lag" making it an unreliable generator of buy & sell signals - well that's true to a certain extent but filtering can alleviate false signals to some degree. Also, each time I made a post on how to use the (CCI) indicator there was a distinct lack of interest.

Check out this post
It's a repository of three trading systems including the CAM Strategy that uses the CCI indicator.


Check what Trading Tuitions has to say about the CCI indicator
A few posts back @MovingAverage gave a practical example of how he added an " Overbought" indicator as part of his buy condition. The backtest results he posted certainly resulted in a boost to the profitability of his strategy.

Why do I mention this?
Well, for this very reason. The Commodity Channel Index (CCI) is an oscillator indicator that accurately identifies overbought or oversold levels, one way of many how you can use this indicator.

Check this link out

Skate.
 
Howard Bandy back in Dec 2016 made these comments
“Stocks have a tendency to revert to the mean and breakouts usually do not last very long. I estimate the risk of drawdown based on recent performance, then trade in such a way that I can manage drawdown. That is, holding a few days at most whether long or short. Again and again. The sweet spot is high accuracy and short holding period. Holding longer than about three days increases the risk considerably, as does accuracy below about 65%”

A short holding period is not for me
Trading over a period of a day or three is easier said than done. I prefer to trade weekly as the joy of trading a daily strategy has eluded me. It's not for the lack of trying it's more to do with the constant workload which is not for me.

Howard Bandy trades short term
Howard Bandy has confirmed that he trades this method successfully. Howard knows what he talking about, he's smarter than the average bunny. Does any member currently trade this way who would like to share their experience?

Skate.
Hi Skate,

I trade in this exact fashion, it is most definately not for the feint of heart. I would love to say it has been a raging success, but I've managed to turn on pretty much all my strategies at the precise moment the broader market takes a dump and so I cannot report any major success. In fact I think people could make a fortune if they just short the markets when I decide to get in...

For this type of strategy I use Howard's book Quantitative Technical Analysis as a guide. I've played with Machine Learning as well as Traditional systems and TBH the best one I've found to date is a simple RSI strategy.

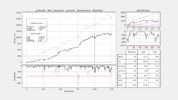
I use python to search all tickers, for each ticker run a walk-forward analysis of the strategy, 2 years inSample, 1yr outOfSample. Generate a report for that analysis. Report contains an image of the equity curve as well as basic metrics Accuracy, W/L but most importantly CAR25 and safeF for my given risk statement.

For each ticker the python script also spits out the parameters for each outOfSample run in amibroker AFL, tradestation easyLanguage and metatrader MQL4 and 5.

I search through the reports manually (a report is only generated if it is at least profitable - reduces number of reports). One of the best I have found was MSFT, I've been trading it for a year or two now with this basic RSI strategy and it has worked well to date.

In order to run a strategy like this I think automation is a must and thus I use either Metatrader or more recently TradeStation.
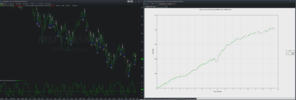
MSFT_inSample-6.png
 
Hi Skate,

I trade in this exact fashion, it is most definately not for the feint of heart. I would love to say it has been a raging success, but I've managed to turn on pretty much all my strategies at the precise moment the broader market takes a dump and so I cannot report any major success. In fact I think people could make a fortune if they just short the markets when I decide to get in...

For this type of strategy I use Howard's book Quantitative Technical Analysis as a guide. I've played with Machine Learning as well as Traditional systems and TBH the best one I've found to date is a simple RSI strategy.

I use python to search all tickers, for each ticker run a walk-forward analysis of the strategy, 2 years inSample, 1yr outOfSample. Generate a report for that analysis. Report contains an image of the equity curve as well as basic metrics Accuracy, W/L but most importantly CAR25 and safeF for my given risk statement.

For each ticker the python script also spits out the parameters for each outOfSample run in amibroker AFL, tradestation easyLanguage and metatrader MQL4 and 5.

I search through the reports manually (a report is only generated if it is at least profitable - reduces number of reports). One of the best I have found was MSFT, I've been trading it for a year or two now with this basic RSI strategy and it has worked well to date.

In order to run a strategy like this I think automation is a must and thus I use either Metatrader or more recently TradeStation.
View attachment 143486
Just want to say it is a VERY interesting post.
Thank you
 
I have a system which trades specific US stocks such as MSFT or VISA etc. The system trades LONG only, holds positions for 1-10 days and is mean reverting in nature. It will trade between 150-250 positions per year. Positions must be taken at the close of the market when the signal for entry or exit is calculated. Currently I trade the system live using Admiral Markets Metatrader 5 platform trading CFD's on the stocks. Automation is important because of my irregular day job. Like all mean reversion strategies the system is highly susceptible to commission drag. Any suggestions or recommendations or past experence with IB or TradeStation would be greatly appreciated as this particular problem is doing my head in...

@Willzy thank you for a great thought-provoking post. I remember you making a post back in December 2020 referencing this type of trading. At the time I had no input as you mentioned software that I was not familiar with, using Amibroker exclusively in my trading.

Howard Bandy's comments
I spent more time than I can remember trying to code a system similar to what Howard was suggesting. I have traded a "Mean Reversion Strategy" with limited success & I found the same as you that "the commission drag" was enormous. Admittedly, stocks do have a tendency to revert to the mean. When Howard implied that breakouts usually don't last very long. I personally had trouble reconciling this "as fact" because it was at odds with my research & experience.

Howard is very experienced
I don't doubt Howard when he said holding only a few days, again and again, is profitable for him but that's his "Modus Operandi" (M.O) or in English "his way of doing things". His statement is at odds with my research of holding for about three days, he even goes on to remark that holding positions beyond three days increases the risk considerably, & accuracy goes out the window.

A short holding period is not for me
Trading over a period of a day or three is easier said than done. I prefer to trade weekly as the "joy of trading" a daily trend strategy or a mean reversion strategy has eluded me. It's not for the lack of trying it's more to do with the constant workload which is not for me.

TBH the best one I've found to date is a simple RSI strategy

Now you are talking my language
I have traded a "RSI Weekly Strategy" with success. It was around (2016 / 2018) that I was trading every profitable strategy I coded up. The last quarter of 2018 brought the house of cards crashing down, taking a complete day to exit all my open positions, it was an exhausting exercise that I never want to repeat. At the moment I trade a fist full of strategies that I find manageable.

When you mentioned a "RSI Strategy" it got me thinking
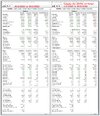
I was wondering if I was still trading this strategy these last two years (the last 730days) would it be still profitable? So there is no cherry-picking the results, I decided to do a backtest from 30/6/2020 to 30/6/2020 inclusive. The last two years haven't displayed consistent returns but have been consistently unkind at times.

I thought it would be a good exercise to post the results
Well on face value the results for this period aren't too shabby. But that period missed the COVID-19 Flash Crash, so I extend the backtest an extra 6 months to take in this period. Taking the COVID period into consideration the overall results become average at best.

RSI BT.jpg

Skate.
 
Just want to say it is a VERY interesting post.
Thank you


Screenshot of the system as of last night.

1656577995582.png

This one looks great and hopefully will continue to work for a bit, but there have been many I traded in this manner that havent performed anywhere near as well, MPWR was one, MA and FISV are others that did well for a while then eventually failed.
This system too will eventually fail, I'll use Bandy's safeF and CAR25 to tell me when to turn it off.

I believe these types of strategies can and do work, but they are hard to find / create / trade and monitor.

Feel free to PM me if you'd like any more info
 
@Willzy thank you for a great thought-provoking post. I remember you making a post back in December 2020 referencing this type of trading. At the time I had no input as you mentioned software that I was not familiar with, using Amibroker exclusively in my trading.

Howard Bandy's comments
I spent more time than I can remember trying to code a system similar to what Howard was suggesting. I have traded a "Mean Reversion Strategy" with limited success & I found the same as you that "the commission drag" was enormous. Admittedly, stocks do have a tendency to revert to the mean. When Howard implied that breakouts usually don't last very long. I personally had trouble reconciling this "as fact" because it was at odds with my research & experience.

Howard is very experienced
I don't doubt Howard when he said holding only a few days, again and again, is profitable for him but that's his "Modus Operandi" (M.O) or in English "his way of doing things". His statement is at odds with my research of holding for about three days, he even goes on to remark that holding positions beyond three days increases the risk considerably, & accuracy goes out the window.

A short holding period is not for me
Trading over a period of a day or three is easier said than done. I prefer to trade weekly as the "joy of trading" a daily trend strategy or a mean reversion strategy has eluded me. It's not for the lack of trying it's more to do with the constant workload which is not for me.


Now you are talking my language
I have traded a "RSI Weekly Strategy" with success. It was around (2016 / 2018) that I was trading every profitable strategy I coded up. The last quarter of 2018 brought the house of cards crashing down, taking a complete day to exit all my open positions, it was an exhausting exercise that I never want to repeat. At the moment I trade a fist full of strategies that I find manageable.

When you mentioned a "RSI Strategy" it got me thinking
I was wondering if I was still trading this strategy these last two years (the last 730days) would it be still profitable? So there is no cherry-picking the results, I decided to do a backtest from 30/6/2020 to 30/6/2020 inclusive. The last two years haven't displayed consistent returns but have been consistently unkind at times.

I thought it would be a good exercise to post the results
Well on face value the results for this period aren't too shabby. But that period missed the COVID-19 Flash Crash, so I extend the backtest an extra 6 months to take in this period. Taking the COVID period into consideration the overall results become average at best.

View attachment 143495

Skate.
I gave weekly RSI trading away when I backtested it over dot com and 2008, it needs an exit mechanism to get you out in those massive dips, but I couldnt find one... stoplosses do not work with mean reversion, at least in my experience.

Perhaps something like using weeklyRSI as entry and then dailyRSI as exit ... food for thought
 
What a great quote
I have to agree with @BlindSquirrel "giving back profits - sucks"

Giving Back Profits "Sucks"
We all tend to be great traders in a roaring bull market & mediocre to lousy traders the other times. Personally, I'm with @BlindSquirrel, giving back profits sucks. Luckily I didn't give all my profits back but it still hurt like a bitch.

I shelved my "Weekly PANDA Strategy" after the COVID-19 crash
Before COVID struck "The Panda Strategy" was a consistent performer. With panic selling during the COVID-19 flash crash period, I considered the exit was too slow to react. At the time I truly felt that the exit strategy fell well short of my expectations. It can be difficult to stay the course during extended periods of drawdown, but in hindsight, that's what I should have done.

Skate.
 
Uncertainty presents an opportunity
I've come to realise that there was nothing wrong with the Panda Strategy, sure there was a slight tweak here & there that I have made since, but nothing too dramatic as the entry & exit conditions were & are still solid. @Willz even remarked sometimes his strategies failed to keep performing but does that mean we should shelve perfectly good strategies?

Maybe following your system is the best course of action even when it doesn't seem like it is
Like most, I've been hard working on a few new systems but it's a long process of evaluation to get comfortable trading a new strategy. Sure there are many of us that look for improvements as our knowledge grows but "not accepting" that sometimes bad things just happen is a fault we all tend to have.

Skate.
 
Last edited:
Most new traders probably also suffer from a dose of over-optimism and Dunning-Kruger effect.....

Dunning-Kruger Effect
The Dunning-Kruger effect that @Newt referenced is a cognitive bias in which people wrongly overestimate their knowledge or ability in a specific area, in our case, that would be "trading". This effect tends to occur because of a lack of self-awareness that prevents us from accurately assessing our own skills or abilities. I just hope, I'm not falling into this category.

I'm better than this
When trading gets difficult it makes us all more determined to trade sharper & smarter. At times we all get delusional thinking that "we are better than this" exhibiting the "Dunning-Kruger effect" as @Newt suggested. Over the last 12 months, I've been soul searching for the next new trading idea. There have been times when we have all tried to fix an issue with one of our strategies when one didn't exist. I certainly have.

I've dragged the "Panda Weekly Strategy" out of hibernation
Why? because "I've come to my senses". The Panda Strategy was a handy performer & still would be (IMHO). I'm just saying, sometimes we overreact. Thinking more about it, there was no good reason to trash this strategy that I'd spent countless hours coding because of a slight mishap two years ago. Frankly, I felt that this strategy didn't perform as expected when the going got tough. Yes, I was disappointed at the time but now realise it was an overreaction. When the "PANDA" turns back on, it will be put to work, meaning, there will be no more hibernation for this Bear.

Skate.
 
Holy C#@P Skate, I must be getting old and predictable. Reading your first today on PANDA weekly getting a back seat really caught my eye. Peter2 has said before what a great little strategy is seemed to be. Didn't realise you'd shelved it in 2020. Couldn't help but have a chuckle at 2nd post mentioning myself and DK.

Your musings today really go to the heart of the matter for a sole system trader. When we're starting out every strategy looks like a secret sauce goldmine nobody has yet been smart enough to figure out. Yep - good old Dunning Kruger. As we get more experienced things getting even more tricky - we have enough knowledge earned from ourselves, or shared from others, so see shortcomings in older strategies that could be improved on.

However, Davetrade had a great post recently that with experience and hindsight he realised all too often he/we should possibly resist the temptation to layer too many clever indicators or code layers:


This post will not be relevant to traders that trade on fundamentals alone. Traders that use fundamentals for stock selection and then use technicals to trade may have encountered some of the problems that I’ve encountered in the past.

I’m basically a technical trader, but I like to know about world and domestic issues that may affect the environment in which I’m trading. So these are the fundamental issues that help give me context to my trading, I don’t look at company fundamentals to make decisions. I will look at some basic information like the sector a company is in and the volume of shares traded.

The point of this post is that I believe that the KISS principle is most important to success in trading, this has been the case for me in my personal journey.

In the past I’ve experimented with building many trading methods using indicators, and a lot of these experiments go something like this;

I’d start with the basic idea using one or two indicators, test and find a problem then add another indicator to fix the problem, test and uncover yet another problem, try to counter this problem with another indicator, etc. The chart ends up looking so congested that I can hardly see the price action but it seems to work until I test it on another segment of data or another market.

This is the type of thing I did years ago when I traded futures, I was 100% technical then. I even created a number of my own indicators and managed to finally create a method that worked specializing in one market, but it worked for two years and then the third year it barely turned a small profit for the year. A year’s workload and just a few dollars for my effort. I knew that I had much more to learn if I wanted to make an acceptable amount of money every year.

If you are doing what I did then I urge you to try a method that is as simple as you can make it, the KISS principle, and make it less specialized by testing to see if each step in your development works for all markets.

Learn from my mistakes if you’re making them and take the shorter road to success.

It does seem from what I've read and learned that very experienced traders "make it look easy" how they strip down their trading to the bare basics of what works for them. We have to remember that trimmed down elegant simplicity is likely best suited for their skill and personality, not everyone else. They spent the hard years playing with lots of things to be able to really hone down to what works for them.

So how to balance KISS and right layers of complexity to protect in a very difficult market. No holy grail, no way to be sure.... :)

I can't find it at the moment, but there was a great little cartoon some years ago comparing experienced fisherman to newbie. Both in the boat out at see. Newbie had 20 lines out, fisher finder, lures, fresh bait - you name it. Empty bucket. Experienced fisherman had one line out and half a bucket of fish :)

p.s.. Nick Radge shared some work he's doing on his (MR?) day strategy on twitter recently. Noted the market is many std deviations away from 10-20 years of past market activity and trying to work out if broken, or markets just "different" now. Seems to be a much greater risk for very short (<3 days) trading systems over slow but steady trend trading.
 
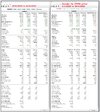
The PANDA Strategy versus the RSI Strategy results
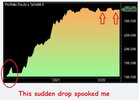
The Panda Strategy fared pretty well, all things considered. I was spooked when the COVID-19 panic selling hit this strategy & many others I was trading at the time. I was extremely disappointed at the time dropping around 19% of my open profits. I was most likely shell-shocked at the time but now realise it was an overreaction. Below is also a comparison of how the "PANDA Strategy" handled the COVID-19 flash crash compared to my "RSI Strategy" that I have reposted below. I should also repeat, that once the PANDA Strategy went to cash it was parked & hasn't been traded since.

Resurrecting the "PANDA Strategy"
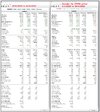
I was wondering if I was still trading the PANDA Strategy these last two years (the last 730 days) would it be still profitable? I have decided to backtest the same periods from (30/6/2020 to 30/6/2020) as well as (1/1/2020 to 30/6/2020) inclusive to give a direct comparison between strategies.

To my surprise
The last two years haven't displayed consistent returns for most systematic trend traders but the "PANDA Strategy" has handled this troubling period (the last two & a half years) pretty well & to my surprise, the strategy has performed well ever since.


PANDA BT.jpg

The PANDA Strategy Portfolio Equity Curve
The red circle shows the COVID-19 equity collapse that instigated parking this strategy.

Parking the PANDAS Strategy was not my finest hour
The red arrows on the right display the period when the Index Buy Filter switched off just after the start of the 2022 calendar year. The Equity Chart below shows the PANDA Strategy recovered nicely after the Index Buy Filter turned back on.

Portfolio Equity.jpg

Comparison results
This is how the RSI Strategy performed during the same period. Reposting the backtest results again in this post saves searching back a few posts to compare it to the PANDA Strategy. The RSI Strategy demonstrates that it couldn't handle the COVID-19 Flash Crash.

RSI BT.jpg

Summary
Well, you live & learn. In retrospect, there was no good reason to stop trading this strategy.

Skate.
 
Last edited:
Still looks like a bloody powerful long only strategy, that has enough smarts to avoid prolonged bear markets. Another way of looking at 2020 might be suspicion if your long only strategy DIDN'T throw a >15% DD at such unusual market conditions. Might be sign of too much "lipstick on the pig". Don't see any lipstick out of place here.....
 
"lipstick on the pig"

@Newt, that's a great expression. If we didn't trust the figures, backtests & strategy evaluation we wouldn't have the confidence to trade the system successfully. Having a half-decent strategy is only half the battle. Confidence really comes from how you react under trying conditions. The COVID-19 panic selling caused me to temporarily lose that confidence in the PANDA Strategy. I firmly believe that the strategy is a small part of trading. In saying this, I wish to make a few observations & a few comments about the mushy stuff, stuff that I believe is not given due credit.

How you handle yourself is more important than the markets
Tough market conditions are based on the emotion of market participants & how you react in times like these will be a decider as to the trader you'll most likely be. Most times you will be your worst enemy, meaning it’s a lot less crucial how markets behave than how you behave.

Emotions pull participants into the markets
Instead of emotionally reacting to the market volatility, responding is a better option, as responding gives you the time to think. As the saying goes, "If what you learn leads to knowledge, you become a fool, but if what you learn "leads to action", you can become wealthy”.

Uncertainty of the markets is a trader’s friend
Thinking about it, all the information we receive comes to us through the framework of human emotions & fear generates the most news. If you can keep your head when all about are losing theirs can help you from hurting yourself by not panicking & selling out too early. As Howard Bandy said, "stocks have a tendency to revert to the mean"

If you get the exit wrong, you're stuffed
It's normally not the downturn that gets you, it’s getting out before the rebound that ultimately gets you in the long run. Once you get out waiting for clarity to get back is a killer. When clarity comes it’s normally too late as the boat has sailed. When prices rise, the value is gone, "in action" is another one of our worst enemies.

Skate.
 

Time to buy tech?


Focus on high-quality global technology companies benefitting from long-term industry disruption.

The Global Financial Crisis (GFC), between mid-2007 and early-2009, proved to be an exceptionally powerful macroeconomic headwind for stocks, resulting in a significant fall in sharemarkets. The past six months reflect the looming presence of a similar macroeconomic headwind.
The drivers of this macroeconomic environment should be no secret: tightening monetary policy and supply-chain issues. The choice of investment to weather this macroeconomic environment should also be no secret: quality companies with secular uptrends (in their industry) and strong balance sheets.
Since the GFC, interest rates have been consistently and anomalously low by historical standards. Meanwhile, loose monetary policy during COVID-19 has been pushing inflation higher since early 2021. US inflation has accelerated from around 2.6% in March of that year to 8.5% in March 2022*.
The US Fed’s subsequent moves to raise interest rates should be regarded as nothing other than expected (although the extent to which rates will increase remains unknown).
Additionally, supply-chain disruptions abound with China’s patchwork process of reopening after COVID-19 lockdowns causing major, global supply chain pain.
Geopolitically, Russia’s invasion of Ukraine and subsequent trade sanctions placed on Russia have put a premium on prices for raw materials such as oil, gas, grain and fertiliser as exports from Eastern Europe are cut off.
Russia’s war and the pandemic have created some speculative bubbles, in Loftus Peak’s opinion. This is shown in the meteoric rise and fall of “lockdown darlings” – companies whose stock prices soared and dropped with the imposition and lifting of COVID-19 restrictions.

Focus on quality​

In today’s macroeconomic environment, company quality is key. Companies with strong balance sheets, good cashflows and current earnings are poised to best tolerate the high interest-rate environment.
Quality in tech companies also distinguishes today's market from that of 2000 during the dot-com bubble.
Capitalisation-weighted Price Earnings (P/E) ratios for US tech stocks in November 2021 were high, with prices cresting at 38 times greater than earnings, according to Loftus Peak analysis. But this does not go close to the cap-weighted P/E ratio of 94.2 in March 2000 for tech stocks.
Another great divide exists between November 2021’s price-to-cash flow (P/CF) ratio of 40.4 in tech stocks and the P/CF ratio of 113.1 during March 2000, Loftus Peak analysis shows.
[Editor’s note: price-to-cash-flow compares a company’s share price to its operating free cash flow per share, and is a common metric that analysts use to assess tech-company valuations. A low multiple can signal better value].
As monetary policy tightens and interest rates rise, economic growth will temper while the cost of capital for companies increases. This can be a lethal combination for smaller tech companies that have yet to establish their business models or a path to profitability, because plugging the funding gap with fresh debt and equity will become much more costly.
A similar story applies to supply-chain disruption. Quality companies will more easily pass on to consumers the cost increases caused by inflation and supply-chain disruption.
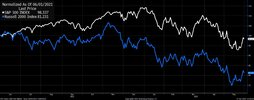
The chart below shows -17.8% underperformance of the Russell 2000 against the S&P500 over the past year. The Russell 2000 is an index of small to mid-cap US companies that generally exhibit much less financial strength than the larger companies that dominate the S&P500 in the US.

1656044692322.jpg
Source: Bloomberg

Where quality mitigates the effect of the inflation and supply-chain disruption, positive secular industry trends provide a path onwards and upwards.
During the GFC, a number of key disruptive trends were working their way through the economy. Smartphones were becoming ubiquitous, the fledgling e-commerce sector was growing strongly, online advertising was taking shape and TV, movie and music streaming began to benefit from faster download speeds.
In the end, the disruptive secular trends benefiting these companies outstripped the macroeconomic headwinds. This resulted in stock outperformance.
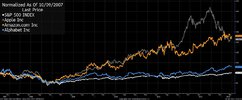
The chart below shows performance of Apple, Alphabet (owner of Google) and Amazon against the S&P500 Index from September 2007 to now.

1656044811799.jpg
Source: Bloomberg

The secular trend in technology today is towards increased computational power - that is to say, semiconductor devices, solid-state storage and networking products.
This need stems not only from growth in traditional end-markets like consumer electronics and enterprise information technology, but also from emerging end markets such as: cloud-enabled data centres, automobiles, 5G and edge computing [edge computing is a distributed computing architecture that bring computation and data storage closer to the data source].
In Loftus Peak’s view, semiconductor companies like Nvidia, AMD and the Taiwan Semiconductor Manufacturing Company, which form part of the Loftus Peak Global Disruption Fund (ASX: LPGD), are balance sheet and cash-flow strong, do not require additional financing and are buying back their stock. This view is of course subject to change over time and based on our own professional analysis.

Conclusion​

The end result of tightening monetary policy and supply-chain issues remains uncertain. However, the promising outlook of quality global technology companies benefitting from secular trends remains a hard act to follow.
[Editor’s note: Do not read the ideas in this story as recommendations. Do further research of your own or talk to a licensed financial adviser before acting on themes in this article. It is important to understand the features, benefits and risks of investing in global technology companies. Growth stocks, such as some technology companies, can be volatile during periods of rising interest rates. Industry disruption can have uncertain outcomes because it is hard to determine how innovation will transform existing sectors or create new ones. Currency movements are another consideration with global investing.]
 
Top