Australian (ASX) Stock Market Forum

Dump it Here

A trading system is usually most effective when "implemented consistently"
One problem frequently encountered by individual traders is the "difficulty" in following a system. Sticking to a system requires discipline & discipline is often difficult when trading - as "emotions" can rule the day. Traders tempted to second-guess their strategy is a recipe for disaster.

You should develop an exit strategy that works
Exit strategies are too numerous to discuss & there is no such thing as the "best" exit. There are exits that work for all styles of trading. Beginners tend to test everything across a broad range of market conditions. That's doing things the hard way. Educate your mind & understand how trading actually works & you can change what you are doing according to market conditions.

More to follow.

Skate.
 
First figure out the trend
There are several ways to do this & they're all easy. On a weekly chart, you can use a 10-week moving average. When the index of choice is above the 10-week moving average, the market is in an uptrend. That's the easiest way to define things. Alternatively, you can use a 100-week moving average on a daily chart. It doesn't matter that much. Pick one.

Okay, how do you determine the trend?
As I said, stick a couple of trend indicators on a chart as they all work about the same. There's no "best" one. See how they look on a chart with a few symbols during a period of time when the market is definitely in an uptrend. Then backtest them on a bunch of stocks. Use the same trend indicator formula for entries & exits. To exit just reverse the entry - don't worry about fine-tuning your exits at this stage. If the trend indicator returns a reasonable amount of money, then you're in business.

More to follow.

Skate.
 
Next, develop your exit
The exit strategy needs a little more work than the entry strategy - so don't look for the entry that makes the most money because the drawdowns can be a killer.

Pick exit strategies that you are comfortable with
Look at the exits on a chart. If you feel good about what you are seeing, backtest them. If the backtest gives you reasonable results even if they're less profitable than some other set of conditions - you're in business.

More to follow.

Skate.
 
Keeping it simple & the performance will follow
Only test your strategy when the market is in an uptrend to start with & see how the system performs. If it does pretty well during the uptrends, then you've got your uptrend system.

Reverse the process for downtrends
Most decent trend indicators identify downtrends just a good as they do up trends. If you backtest test your uptrend system when the markets are in a downtrend, guess what - it will perform poorly & I'll let you know shortly why.

More to follow.

Skate.
 
Now, why would you trade it during a downtrend?
Well, here's a clue - "don't" unless you want to lose your money.

Index Filters
I'm suggesting that you use an Index Filter (when first starting out) or until you sort this conundrum out. An "Index Filter" can stifle a good strategy but until then - stay on the side of caution. The more you trade - the more you will understand the markets. I'm first to admit, getting your head around "how trading really works" - is really hard.

Here I go again - "Entries mean little"
You can use almost anything to enter a position when the markets are in an uptrend. During trending markets, money is easily made. In the sideways markets, very few strategies make money. Trading in a downtrend is even harder. So, "only hold positions in an uptrend" it's a no-brainer. If you trade a good strategy in a downtrend, it's going to look very, very bad, & it should. So don't struggle trying to "fix something that's most likely not broken".

More to follow.

Skate.
 
There is no "one best" strategy
There are strategies that will allow you to trade with enough success to make money. Most trading books talk about somebody's personal trading system or a system that beginners can't seem to get enough of. You never hear that their system only works well when the market is in an uptrend - that's common with all strategies that perform. Develop your own simple methods. It will serve you much, much better.

I've said it before & I'll say it again
Watching "YouTube" videos is better than reading a book. Why? Reading requires deep concentration & being in the moment. Your mind wanders constantly without realising it.

6-minute videos
For those who want to understand the basics of systematic trading, watch the next series of videos they will serve you well. There are 47 in the series but you only need to watch the handful I'm recommending. The videos can explain it more succinctly - allowing me to stop rambling.

More to follow.

Skate.
 
The internet is chock full of those pushing their own barrow
Forget the marketing, pay attention to "information". I've selected these educational videos as it's as basic as it gets as far as system trading goes. Understand the principle behind the method & you'll be well-grounded.

There is something for everyone
Even seasoned traders who are currently struggling with their trading trying to "figure out" why their systems are letting them down - this series of videos is for them as it will help to explain why. If I was in this group of traders, I'd to the first to try & understand why trading is not performing in line with backtest results.

Repeating what we already know
It takes time for a poster to pass on information they already know in the hope it resonates with a few. All I'm asking in return is to watch a series of short videos attached.

Please watch the videos in order - it won't take long

1.1) Algo Trading for a Living | Making it all worthwhile and reaching your full potential. - YouTube

1.2) Algo Trading for a Living | Are you over-leveraging, and risking everything? - YouTube

1.3) Algo Trading for a Living | How to increase the profit-making potential of your capital - YouTube

2.1) Fine-Tuning Trading Systems by Analyzing Trade Open and Close Data | Algo Trading for a Living - YouTube

2.2) Trade Entry and Exit Timing Optimization for Algorithmic Traders | Algo Trading for a Living - YouTube

3.1) How to Improve your Algo Trading | 14 Hints & Tips - YouTube

3.2) Algo Trading | Making your hard work worthwhile | 14 Hints & Tips to take you to the next level - YouTube

3.3) Your Trading Strategy Premise and Edge | 14 Essential Algo Trading Hints and Tips - YouTube

4.1) Fourteen Rapid-Fire Tips for Algo Traders (Tips 8-14) - YouTube

4.2) How to reach your full potential as an Algorithmic Trader | 14 Algo Trading Hints and Tips - YouTube

4.3) Why your trading system can lose its edge | 14 Algo Trading Hints and Tips - YouTube

Skate.
 
Aiming for the "1%" email..(again).
It's all doom and gloom. ;)
1% email received for the last week, woohoo. (Monetary figures edited out.)
It's just a percentages & numbers game, is the way i look at it. I find its easier to accept losses in your stride this way.

30 week position email edit.jpg

You may elect to stop trading in sideways markets
A lot of traders keep their positions open in sideways markets where I don't. Traders fail to realise you don't make much money going sideways. In a sideways market, if you violate the rules of (a) good money management or (b) a sound "stalestop" exit strategy, you are going to pay, & pay dearly. This is when an exit strategy is everything when trading.

I had a little think about this, so out loud...

So, what entails a sideways or crabby market?

Lets use the example of;
say 50% of stocks are going up, and 50% of stocks are going down, thus balancing out to a flatline.
(For this example let's ignore market capitalisation or MC.)

In reality, it may be very different when taking into account MC, but I would hazard a guess statistically, (law of averages/ big numbers), that the 50:50 scenario could be close to reality.
Not necessarily so and in any case, shouldn't be assumed so, however without data to prove it either way, lets go with 50:50.
This means in a sideways market, in theory, out of a random selection of 10 stocks, 5 may go up, 5 may go down.

So, what entails a uptrend or bull market?

Same as above except the ratio will be higher as the trend is up.
Example; 70% of stocks are going up, 30% are going down.
(For this example, again let's ignore market capitalisation or MC.)
This means in a uptrend market, in theory, out of a random selection of 10 stocks, 7 may go up, 3 may go down.

A bear trend?

Lets just reverse above;
Example; 30% of stocks are going up, 70% are going down.
This means in a downtrend market, in theory, out of a random selection of 10 stocks, 3 may go up, 7 may go down.

What is this; Amateur Hour?
Yep it is... the thread is in the beginners area after all, and I ain't an expert (a drip under low pressure..)

Back to Market Capitalisation

Lets bring market capitalisation into the mix, just in theory only, and apply it to the above examples.

In thinking about the value of any one particular company in comparison to another particular company, it has the potential to sway these basic statistics dramatically.
Example;
MQG with a MC of $ 52,175,000,000 (lets call it $50 billion) and
BOQ with a MC of $ 4,954,000,000 ($5 billion rounded up ?)

So using these two companies as example,
whatever effect BOQ has on moving the indicie or sector index it comes under, (being the XFJ or S&P/ASX 200 Financials), the effect that MQG will have will be 10 x greater than that of BOQ.

So we see, apples aren't apples.
To say the market is going sideways, doesn't actually mean that out of a random selection of 10 stocks, 5 may go up, 5 may go down.

In reality, it may be closer to either of the bull or bear trends figures in relation to actual STOCK figures going up or down.
Without hard data analysis to prove actual numbers, its just guesswork.

That leads me to thinking of individual indicies, which could be thought of "one bigarse stock" in comparison to the All Ordinaries, being the final indicie or aggregrate of the whole market.
So again, if a few of these "bigarse stocks" (ie; individual sectors) have a bigger overall MC (or weight), they have the power to sway the All Ordinaries (the market aggregate) potentially in a different direction to the theoretical majority of stock directions.

So the question I pose, is a bull trend really a bull trend, is sideways really sideways, is a down trend really a down trend when the above is taken into consideration?

By monetary valuations or MC they are, no doubts about it. (I guess "follow the money" can be taken at either macro or micro levels.)
By grass roots individual stocks movements, without statistical data to prove it, the trends are hidden by the noise of the bigger end of town.
I believe this may provide quite a few niche trade areas in a few sectors at any one particular time, regardless of the overlying and in your face market trends and sentiment.
Further, I believe in these niche areas/ sectors, rotation is rife.

I should stop thinking out loud now, apart from thinking;
does anyone know if (or how) Amibroker can extract statistics such as mentioned above to determine what exactly is going on with overall individual sector constituents (stocks) directions?
Cheers. ?
 
It's all doom and gloom. ;)
1% email received for the last week, woohoo. (Monetary figures edited out.)
It's just a percentages & numbers game, is the way i look at it. I find its easier to accept losses in your stride this way.

View attachment 121048


I had a little think about this, so out loud...

So, what entails a sideways or crabby market?

Lets use the example of;
say 50% of stocks are going up, and 50% of stocks are going down, thus balancing out to a flatline.
(For this example let's ignore market capitalisation or MC.)

In reality, it may be very different when taking into account MC, but I would hazard a guess statistically, (law of averages/ big numbers), that the 50:50 scenario could be close to reality.
Not necessarily so and in any case, shouldn't be assumed so, however without data to prove it either way, lets go with 50:50.
This means in a sideways market, in theory, out of a random selection of 10 stocks, 5 may go up, 5 may go down.

So, what entails a uptrend or bull market?

Same as above except the ratio will be higher as the trend is up.
Example; 70% of stocks are going up, 30% are going down.
(For this example, again let's ignore market capitalisation or MC.)
This means in a uptrend market, in theory, out of a random selection of 10 stocks, 7 may go up, 3 may go down.

A bear trend?

Lets just reverse above;
Example; 30% of stocks are going up, 70% are going down.
This means in a downtrend market, in theory, out of a random selection of 10 stocks, 3 may go up, 7 may go down.

What is this; Amateur Hour?
Yep it is... the thread is in the beginners area after all, and I ain't an expert (a drip under low pressure..)

Back to Market Capitalisation

Lets bring market capitalisation into the mix, just in theory only, and apply it to the above examples.

In thinking about the value of any one particular company in comparison to another particular company, it has the potential to sway these basic statistics dramatically.
Example;
MQG with a MC of $ 52,175,000,000 (lets call it $50 billion) and
BOQ with a MC of $ 4,954,000,000 ($5 billion rounded up ?)

So using these two companies as example,
whatever effect BOQ has on moving the indicie or sector index it comes under, (being the XFJ or S&P/ASX 200 Financials), the effect that MQG will have will be 10 x greater than that of BOQ.

So we see, apples aren't apples.
To say the market is going sideways, doesn't actually mean that out of a random selection of 10 stocks, 5 may go up, 5 may go down.

In reality, it may be closer to either of the bull or bear trends figures in relation to actual STOCK figures going up or down.
Without hard data analysis to prove actual numbers, its just guesswork.

That leads me to thinking of individual indicies, which could be thought of "one bigarse stock" in comparison to the All Ordinaries, being the final indicie or aggregrate of the whole market.
So again, if a few of these "bigarse stocks" (ie; individual sectors) have a bigger overall MC (or weight), they have the power to sway the All Ordinaries (the market aggregate) potentially in a different direction to the theoretical majority of stock directions.

So the question I pose, is a bull trend really a bull trend, is sideways really sideways, is a down trend really a down trend when the above is taken into consideration?

By monetary valuations or MC they are, no doubts about it. (I guess "follow the money" can be taken at either macro or micro levels.)
By grass roots individual stocks movements, without statistical data to prove it, the trends are hidden by the noise of the bigger end of town.
I believe this may provide quite a few niche trade areas in a few sectors at any one particular time, regardless of the overlying and in your face market trends and sentiment.
Further, I believe in these niche areas/ sectors, rotation is rife.

I should stop thinking out loud now, apart from thinking;
does anyone know if (or how) Amibroker can extract statistics such as mentioned above to determine what exactly is going on with overall individual sector constituents (stocks) directions?
Cheers. ?
Indexes are used for different purpose, i used xnt for example to compare the results of my systems.that way, i know if i am better off working these system or just put money in an etf asx200.
Then index used as an indicator: well you are right in Australia especially, the banks rio bhp woolies and coles are an enormous part of the ASX so having the ASX down does not mean you are not part of boom8ng bull market in a sector or small caps.
I will just say that when crashes occur, it is very hard to find anything going up..
But tech did boom during the so called covid crash etc.
Ideally, you should use sector index but then what is the lunk between technology 1 and Google...same sector..not much in common.
You have to use crude tools.
What is this 1%?
If i understand well a comparison between your portfolio and the portfolio of a very narrow tribe using that broker so very specific type of investors? Think about it? Why do you even care? Ego polishing maybe..probably why this broker does that but you know nothing of the comparison sample.i would unsubscribe from this ASAP if i were you.can not be beneficial in any way imho
Sorry for the typos above and missing s etc, smartphone typing has its limit
 
does anyone know if (or how) Amibroker can extract statistics such as mentioned above to determine what exactly is going on with overall individual sector constituents (stocks) directions?
Here's another useful tool. Look through the rest of the thread for usage examples.
Norgate Data - Determining the Sector/Industry Index symbol for the current security

I had been using some code to look up the relevant index and thought that there must be a better way to do this.

I read the Norgate usage page ( https://norgatedata.com/amibroker-usage.php#hics ) and couldn't figure it out, so I emailed Norgate and @Richard Dale was kind enough to provide a solution that works for me.

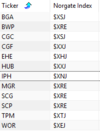
NorgateIndex = NorgateIndustryIndex("$XJO", 1 ,"PR");
AddTextColumn( NorgateIndex, "Norgate Index");

This returns the following when put into exploration
1615348243513.png
 
Now, why would you trade it during a downtrend?
Well, here's a clue - "don't" unless you want to lose your money.

Index Filters
I'm suggesting that you use an Index Filter (when first starting out) or until you sort this conundrum out. An "Index Filter" can stifle a good strategy but until then - stay on the side of caution. The more you trade - the more you will understand the markets. I'm first to admit, getting your head around "how trading really works" - is really hard.

Here I go again - "Entries mean little"
You can use almost anything to enter a position when the markets are in an uptrend. During trending markets, money is easily made. In the sideways markets, very few strategies make money. Trading in a downtrend is even harder. So, "only hold positions in an uptrend" it's a no-brainer. If you trade a good strategy in a downtrend, it's going to look very, very bad, & it should. So don't struggle trying to "fix something that's most likely not broken".

More to follow.

Skate.


Mr Skate @Skate has designed systems that do not seemingly rely on entries. There are alternative threads that emphasise entries see @peter2 and @tech/a threads.

I also am an 'entries' man.

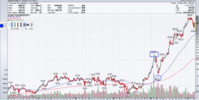
Let us look at various entries into TSLA, but it is applicable to any stock.

So Mr Skate runs (predominantly) weekly systems, so I have focussed on the weekly timeframe. Obviously I have emphasised the point that I wish to make. Also, all the analysis is hindsight, which makes everyone look like a genius.

An entry at the box is obviously less optimal than an entry at the circle.

This leads directly into a second point: stop losses. SL are a risk management tool. There was some discussion re. SL's on tech/a's thread, that unfortunately was cut short. The point however is, there is a natural market support area that logically supports a SL, which is the entry at the circle. This SL is information as opposed to noise.

Where exactly, would you place a SL on an entry at the square? There is no logical market based point at which a SL conveys information rather than noise. Any SL at the square is simply noise. The SL will be almost certainly be calculated on the trader's risk tolerance. This is nonsense. A trade is not entered on risk tolerance. A trade is entered on a probability of success.

As markets are fractal, a SL can be placed 'logically' in lower timeframes. As a reference, higher timeframes should be monitored as the noise/information ratio rises in lower timeframes.

Some further thoughts on SL: they are a tool which are (very) far from being infallible. To be infallible, price would need to follow a stochastic process. Price does not do so: (the closest markets too this are currency markets) markets close each day, at the weekend and most importantly, even intra-day when trading is suspended. This fact invalidates a SL as an infallible risk management tool. I gave up using SL as risk management tool 15 odd years ago.

Trailing SL have a use, but they also have all the above issues. The primary reason for a trailing stop is that your trade has met the expectation of your initial analysis in placing the trade and you are trying to maximise your profit through serendipity. That is a valid use of a trailing SL. A trailing SL and a market/instrument exit are however not the same thing. I won't belabour the point, but it is something that each trader will need to come to terms with based on their individual strategy.

Screen Shot 2021-03-13 at 9.26.36 AM.png

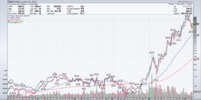
Mr Skate suggested monitoring the market. An excellent idea. Easily done.

Screen Shot 2021-03-13 at 9.28.49 AM.png

Further filters can be considered: the stock as a ratio to the market or outperformance, which indicates a strong(er)/weak(er) trend as compared to the market.

This type of analysis is an alternative method for gauging the strength of the trend of the stock to the market. It allows you to trade stronger counter-trend stocks in weak (sideways) markets and even (carefully) Bear markets.

Screen Shot 2021-03-13 at 9.30.07 AM.png

Which brings us back to entries.

The advantage of a timely entry is that it gives us timely (informational) exits. Now exits are where you either book your profit or loss. A better entry is a better exit.

In summary: entries and exits are opposite sides of the same coin: the coin being each individual trade. They are synergistic. An easy way to increase your edge and profitability.

jog on
duc
 
I am a novice and not an especially successful one, but i start with basic entry selection then refine exits, often common ideas between most strategies,then go back to entries..which i find harder
There are gems in Mr Ducati post above.
Many thanks
Ps i find it bothering to have a profitable strategy with around 30pc win rate , and think about all the losses which could be reduced..so look at entries then
 
Mr Skate @Skate has designed systems that do not seemingly rely on entries. There are alternative threads that emphasise entries see @peter2 and @tech/a threads. I also am an 'entries' man.

I've elevated the "entry" to "significant"
Most traders concentrate on the entry believing if the "right" stock is bought at the "right" time all will work out in the end. In my experience, the correct timing of the exit is where the money is ultimately made.

Good entries improve the trade potential.

I am a novice and not an especially successful one, but i start with basic entry selection then refine exits

My views in the 'Dump it here' thread are just that
Whether you agree with my point of view or whether I'm right or wrong isn't important - all members have the right to freely express a view or an alternative view, the essence of this thread. When @ducati916 posts I take notice, he is one member whose views are always "on the money". It's refreshing when members take the time & effort to post alternative points of view.

The entry is important & significant
Trading is all about timing the entry as "buying" at the right time is important to the success of any trading system that @Beaches alluded to. I should also correct the record by saying that all my systems rely on timing the entries which is "significant" however, with mechanical trading, timing the "exit" is still the hardest part of coding a half-decent strategy.

Alternative Views
Over the last two years, I've raised the question around the "entry versus the exit" scenario & which is considered more important when it comes to the "profitability" of any trading plan. I still hold the position that the "exit" is where the money is made. I now have to concede the entry is also significant - otherwise, each strategy performance would mirror each other.

Most people tend to remember the last thing that they read
So, in the spirit of reinforcing my position, I'll make a series of posts slanting the discussion towards why "timing the exit" trumps "timing the entry".

Skate.
 
To keep it simple - as traders want to know
(1) what to buy
(2) when to buy &
(3) when to hop off the ride.

All three elements are important
If you can nail these three you are halfway there in developing a handy strategy, however, the profitability of a strategy depends on doing a few other things precisely.

Skate.
 
Trend following is a system proven
I’m dumbfounded that there are so many ways to bet on the share market but over a long period I've found it’s much easier to go with the trend rather than fighting against it. @ducati916 mentioned @peter2 & his style of trading. (posted in his "p2-asx-weekly-portfolio").

I'm just saying @peter2 style depends on experience & skill
The style I trade is a little bit different & a lot less complex. Both threads ("p2-asx-weekly-portfolio" & the "Dump it here" thread) aim to educate in their own unique way by explaining how to capture price fluctuations - exploiting profitable repeatable patterns.

Entries are a dime a dozen
There is always robust banter when I raise the benefits of the "exit versus the entry". I consider the "exit" is "fractionally" more important than the "entry" when it comes to profitability as "exits" is ultimately where the money is made.

Getting out is always emotional
Timing the exit is extremely difficult whereas getting into a trend is much easier as trends are happening all the time. Let's not split hairs, trends are trends & there are so many different types. There are even trends within a trend.

Skate.
 
When others disagree
The "Dump it here" thread gives a perfect platform for others to express an alternative view rather than debating that one is better than the other. The "Dump it here" thread is for the "exchange of ideas, not a contest of ideas".

Traders make money in the markets by exploiting changes in prices
Most traders put all their effort into buying whereas I support the idea that successful traders put most of their effort into selling. While I concede stock selection & timing the entry is important - but - when the trade is closed is far more important to the "profitability of the strategy". All I'm saying "selling is where we (ultimately) make our money" & it’s "much more important" than the dime-a-dozen buy-in strategy.

What's trading all about
As traders, we buy a position in the hope that sometime in the future, we will be able to offload our position to someone at a higher price than we brought it.

I'm just saying
"Timing the offload is considerably more difficult than buying into a position"

Skate.
 
In my experience, the correct timing of the exit is where the money is ultimately made
Cutting losing trades early & holding better positions is the secret of being a profitable trader. When a trade goes against you - how you handle the position will eventually decide how successful you will be as a trader. IMHO - the timing of your exit has to be the most important part of your trading strategy.

Making money trading
How do we make money trading? - to me, it's the wrong question. To me, I'm more concerned with answering the question - How do you prevent losing your money when trading?

Explanations of how not to lose your trading funds
@peter2 explain this in detail, whereas @ducati916 takes a different & unique approach both methods require skill & experience. Experience comes from the time in the markets.

Time in the markets
The lack of time is the missing ingredient when it comes to beginners just starting out on their trading journey. Trying to understand something that's complicated "that seems" to be simple is the second part of the equation.

Skate.
 
Top