Australian (ASX) Stock Market Forum

DrBourse FA Help for Beginners

DrBourse

If you don't Ask, you don't Get.
Joined
14 January 2010
Posts
884
Reactions
2,067
Anyone that plays in the "ASX Sandpit" needs to understand that the following is how a lot of unmentionables make their living, unfortunately "off the masses".......
During the year and in particular during Feb & Aug each year the “The Guesstimate Seasons” begin, Financial Results have been published and digested by all the Experts, where those Expert Broking Houses and Analysts try to Guess what the upcoming Targets will be, (& also what next year will produce) for varying Companies.
I would suggest Extreme Caution, as history has shown that most of these Guesstimates are WRONG.
It's a Game that most Expert Analysts, Broking Houses & Economists play – they are consistently wrong - nearly every year on nearly every stock they "Over Guesstimate Projected Earnings", then when they realise they were wrong yet again, they issue a downgrade within a few months (or Years) that conveniently meets the then current price.
Their Inflated Guesstimates continually lead the Sheep up the garden path as they force the prices up, then the same Expert Analyst’s, Broking Houses & Economists do a downgrade, so they can buy when the Sheep have to sell --- SOME OF THESE ANALYSTS ARE REALLY JUST LICENSED RAMPERS --- Grrrrrrrrrrr.
Admittedly some Broking Houses receive Briefings directly from some Companies, the problem with that is that the Broking houses then somehow manage to ‘embellish’ those briefing figures to ridiculous levels, they manage to use words like, ‘we anticipate, we calculate, we project, etc, etc.
Broking Houses can’t be seen to just relay the Co Briefings ‘word for word’ as the Companies quote them – that would render the Brokers Reports as “useless repetition”.

IMO, Brokers Exist only to make you "BROKER"......
 
The Public NEVER get to see the Actual/Correct & Up-to-Date Financials from any Company - the best we can get is from the Co itself, and those figures are only what the Co wants us to see, and by the time we get to see them they are usually 2 or 3 months "Out of Date".
Any other Analysis on a Co's financials usually include some of that Analysts own "Guesstimates" on what the published Financials actually mean - each one uses poetic licence to embellish their own individual publications - Analysts can’t be seen to just relay the Co Briefings ‘word for word’ as the Companies quote them – that would render the Brokers Reports/Analysis as “useless repetition”.

What you need to do is work directly from the Co's Published Financials, the best way to get those are from each Co's web site.

Then you need to calculate your own Ratios, Margin of Safety etc..

A suggestion for you is to check out the Top 20 Shareholders...Banks & Financial Institutions are pretty good at analysing Financials - If you see that a Co has Banks & Financial Institutions in that Top 20, list then you can be pretty sure that the Co's Financials are better than Good, usually Very Good to Excellent.

Banks & Financial Institutions do not buy on Rumours, Ramping or outlandish Media and Analysts Reports.
 
Two words I look for in any announcement are - "Audited or Unaudited"....
In other words, did some junior clerk collate the data then pass it on to the scribe, who passed it on to someone else to publish it all as a price sensitive announcement and as an Unaudited press release....Did the CEO or any members of the Board verify the data.... if so why is that not stated in the press release.....Most Co Execs shy away from such accountable comments....
Unaudited Announcements that do not carry Senior Co Execs Endorsements are suspect IMO.....

OR.....

Has the data been properly Audited by a Reputable Company......

Like the old addage said - "If it sounds too good to be true etc etc"......
We need PROOF and ACCOUNTABILITY.....What we don't need is a bunch of unsubstantiated data......
 
Balance Sheets are too complicated for most people to understand……
There are numerous people who expertly analyze these Balance Sheets….
Their analysis is available from various Magazines, Newspapers & Internet Sites…..
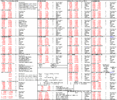
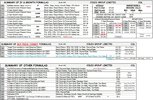
So, I have built up a “Matrix” that quickly helps me to identify the Good, the Bad & the Ugly…...
This Matrix and it’s Ratio Grading's help me identify Companies that meet my selection criteria……
You may need to amend some of these numbers to suit your level of tolerance……
There are dozens of expert opinions for “Margin of Safety (MOS) & RATIO's”, Just Google whatever it is you want to understand…..
The Matrix replaces page 161 in my original Manual from the late 1990's....
 

Attachments

  • Page 161 Bal Sheet Ratio Matrix.gif
    Page 161 Bal Sheet Ratio Matrix.gif
    71.5 KB · Views: 93
Two words I look for in any announcement are - "Audited or Unaudited"....
In other words, did some junior clerk collate the data then pass it on to the scribe, who passed it on to someone else to publish it all as a price sensitive announcement and as an Unaudited press release....Did the CEO or any members of the Board verify the data.... if so why is that not stated in the press release.....Most Co Execs shy away from such accountable comments....
Unaudited Announcements that do not carry Senior Co Execs Endorsements are suspect IMO.....

OR.....

Has the data been properly Audited by a Reputable Company......

Like the old addage said - "If it sounds too good to be true etc etc"......
We need PROOF and ACCOUNTABILITY.....What we don't need is a bunch of unsubstantiated data......
Audit fees can be prohibitive - BHP paid $16.7M last year - so I don't share that concern.
Also, company releases must carry the name of the person authorising it. People giving materially false or misleading information may be prosecuted for committing a criminal offence under the Corporations Act, so in the absence of competing information we have nothing better to rely on.
Furthermore, ASX continuous disclosure requirements for companies are nowadays onerous, so any information concerning it that a reasonable person would expect to have a material effect on the price or value of its securities must immediately be advised to the ASX.
There's a daily updated thread on price sensitive announcements started by @barney that should be essential reading for investors.
People wanting to be thorough could use your matrix to determine if an announcement materially changed their expectations for any particular company.
 
Contrarians are people that challenge conventional market wisdom by applying intellectual rigour and plain common sense to theories often used to explain share price movements – Contrarians are also the ones who buy stocks that are ‘out of favour’ according to some well defined fundamental measures, such as low PE, low PB or high Div Yield.
 
Earnings Stability simply means a company is able to produce a fairly predictable pattern of earnings. That could be a desirable record of solid gains. EPS Stability Rating is a measure of consistency in earnings growth. Like many ratings, it runs on a 1 to 99 scale.(where 1 is excellent & 99 is Terrible) BUT anything below 25 is OK......
Technically speaking, earnings stability is a percentage value showing one standard deviation of the variability around the trend line fitted through three to five years of earnings history. Therefore, the lower the number, the more stable the company's earnings history. A company that reports consistent earnings growth of, say, 25-27 percent each quarter over three to five years will have an earnings stability near 1 (%) while a company that reports earnings varying from 5 percent in one quarter to 85 percent in another to -15 percent in yet another will have a substantially higher earnings stability value. Keep in mind that our proprietary Earnings Per Share Rating factors in earnings stability.

For more info just Google “Earnings Stability Definition” OR “Earnings Stability Formula”.
 
The Cash Flow per share ratio tells - in theory - how much actual cash the company has generated, per share, from its operations….
“The Ratio is not exactly a true measure of Cash Flow. It is simply the company's depreciation & Amortisation figures for the year added to the after tax profit, and then divided by a weighted average of the number of shares.”…
Depreciation and amortisation are expenses that do not actually utilise cash, so can be added back to after tax profit to give a better of indication of the company's actual Cash Flow….
By contrast, a true cash flow - including such items as newly raised capital and money received from the sale of assets - would require quite complex calculations based on the company's statement of cash flows….
However, many analysts use the ratio because it is easy to calculate and it is certainly a useful guide to how much funding the company has available from its operations….
A prominent Portfolio Manager said: When looking for cheap stocks, we look for free future cash flows and companies with pricing power that have control of what profits they make….
An indicator of impending cash-flow problems is the Current Ratio, which is Current Assets divided by Current Liab's….
Current Assets can be converted to Cash within 12 mths, while Current Liab's usually are due within 12 mths….
If there are more Current Liab' s than Current Assets, Cash Flow could be crunched….
Some investors prefer companies with a Current Ratio of more than 2, but companies with relatively short payment cycles - for example, retailers - may have lower Current Ratios….
Do extra research when the current ratio falls below one….
Even better is the Quick Ratio, which excludes Inventory. Inventory can be a potential Landmine….
A smaller retailer, for example may be overstocked with clothing it can't sell, but avoids writing it off….
An Inventory blowout relative to sales is another useful indicator of potential problems….
Look at Current & Quick Ratio's for companies over several years to determine Cash Flow trends….
Net cash from operating activities, divided by the diluted weighted average number of ordinary shares outstanding. Net cash flow represents cash from operating activities. It includes tax, but does not include capital expenditure. Free cash flow can be derived by subtracting capex per share from cash flow per share….
 
Buffett suggests that a Co’s PE should be 20% below the ‘Maximum Market PE’ - that narrows the field down quite a bit……..
The formula for the “Max Mkt PE” is - 100 div by the current 10 Yr Bond Rate = Max Mkt PE…..
 
One of the hardest figures to calculate when you are working on a Companys IV, is the "Maximum Required Rate of Return" or "The Investor's Required Return"..... This mythical percentage is published from time to time by Reputable Analysts (yeah right)....
OR....
You could calculate it for yourself....The 5/8/18 Weekend Australian quotes "Forecast EPS" for the ASX200 for 2018 as 5.9%, & for 2019 as 7.8%, & for 2020 as 9.8%.....
SO - Here we go -....
IMO, The Investor's Required Return is a number that takes into account firstly, an expected rate of return.....
This is a compounded growth rate, or Forecast EPS of 5.9%, which is arguably a rate of return people are willing to recieve .....
The Investor's Required Return should also take inflation into account, which according to statistics, has averaged 3% over several hundred years.....Comsec tells us that the Inflation Rate is 1.9% as at 17 Aug 2018....
Finally, The Investor's Required Return should also take into account a compensation for risk - what is known as the 'Equity Risk Premium'.....
If this additional rate is, say, 3%, then the Investors Required Return is:- 5.9% + 1.9% + 3% = 10.8%.....
THEN .....
To calculate our Investors Required Return Start with 10.8% for 2018, (& maybe 11% for 2019, then 11.5% for 2020, & 12% for 2021)......
ADD 0.5% for slightly Above Average Debt,....
ADD 1% for Very High Debt,....
ADD 1% for Foreign Countries Political Interference & Unrest,....
ADD 1% for Average Write Downs or Losses,....
ADD 2% for Very High Write Downs or Losses,....
DEDUCT 0.5% for Below Average Debt,....
DEDUCT 1% for No Debt,....
DEDUCT 0.5% for Dominant Companys,....
DEDUCT 0.5% for Stable Long Standing Companys.....
Hope you can understand all that...
 
I do not use a Conventionally Accepted Stop Loss or Trailing Stop Loss System…I feel that those systems belong to the Longer Term Investors…Once I have in my opinion, enough Signals/Signs from my Tools of Trade, I will act immediately…For example if a Bearish Candle Pattern and/or my Indicators suggest that a pullback or downtrend is imminent I will follow those signals and exit the Trade immediately…If I were to use a % Stop Loss System (of say 2%) and my Tools of Trade gave me enough signals to exit for say 0.5%, I would be crazy to hold and watch any small loss be increased just because that “% Stop Loss System” told me I had to wait till my losses reached that magical 2% - it would be easier to just give some money away…Admittedly I sometimes exit a trade early – but I prefer to be cautious – and if my Tools of Trade suggest continued uptrend then I can easily re-enter the Trade.
"You can assist whatever Stop Loss System you use by "Correct Stock Selection" & "Correct $$ Management" - for example - If you invest $50k in Penny Dreadful’s like LKO shares you will probably activate your Stop Loss System immediately, and if you are not quick enough you could lose the lot - On the other hand $50k invested in BHP shares would be a safer trade, less risk, probably less profit but better protection for your capital“.
IMO, Traders should not get too involved with Stop Loss points - I do not use a Conventionally Accepted Stop Loss or Trailing Stop Loss System….I feel that those systems belong to the Longer Term Investors….Once I have in my opinion, enough Signals/Signs from my Tools of Trade, I will act immediately….For example if a Bearish Candle Pattern and/or my Indicators suggest that a pullback or downtrend is imminent I will follow those signals and exit the Trade immediately....If I were to use a % Stop Loss System (of say 2%) and my Tools of Trade gave me enough signals to exit for say 0.5%, I would be crazy to hold and watch any small loss be increased just because that “% Stop Loss System” told me I had to wait till my losses reached that magical 2% - it would be easier to just give some money away....Admittedly I sometimes exit a trade early – but I prefer to be cautious – and if my Tools of Trade suggest continued uptrend then I can easily re-enter the Trade....- the idea is to trade when there is a trade to be made, and even then you should 'Play the Trade' (like playing a Fish), you should not trade the $$$'s - get the trades right and the $$$'s will automatically follow.
Most Traders use strict Stop Loss systems I primarily use my Indicators as my initial Stop Loss System, when they turn Negative, I jump - the other system is a "TSL" = Trailing Stop Loss of a $/c value - so had everybody been using some sort of Stop Loss they would have a small Trading Loss to use as a Tax Ded'n -
"You can assist whatever Stop Loss System you use by "Correct Stock Selection" & "Correct $$ Management" - for example - If you invest $50k in LKO shares you will probably activate your Stop Loss System immediately, and if you are not quick enough you could lose the lot - On the other hand $50k invested in BHP shares would be a safer trade, less risk, probably less profit but better protection for your capital".

Suggest that you try this site http://www.incrediblecharts.com/ , lots of FREE Educational Info...On the Incredible Charts Home page, top right hand side, do a search for ‘Stop Loss’...
Also see my snapshots 112, 116 & 160...Then do a Google Search for Stop Loss - dozens of good explanations there...
 
A lot of Day Traders prefer to use alarms rather than Stop Loss Triggers..... Most of the Software Trading Platforms (Metastock, Incredible Charts, etc) have an alarm system that may be of use to you..... I have an average of 20-25 alarms that I review Daily.... You can usually set these alarms on a SP, an Open, a Close, a High, etc, some can be set for release of an announcement - lots of other parameters may be available depending on the program.... the obvious drawback with alarms is that you have to be online when the alarm is triggered for it to be of any value...
 
All seems to be very complicated and long winded, I guess each investor needs to find a process they have conviction in, but that wouldn't work for me.

I can usually tell within 2 minutes of looking at a business whether its potentially investible (most are not), I would do a few hours research & analysis before taking a starting position if it looks like the business is investible based on my criteria.

There are some really good tools out there for helping with the process, I use Uncle Stock for screening and QuickFS is an invaluable tool for the quick assessment of investibility.

I developed my own spreadsheet for my process, its got much simpler over time, I work out ROIIC over at least 5 years, a quick and dirty FCF DCF to give me a range of valuation, some inversions/reverse engineering to understand what assumptions are needed for growth to underpin current price and what FCF is assumed in current price. It also checks margins, FCF yield and earnings yield. It all fits on one easy to use sheet.

EDIT - more posts made while i was writing this, as a long term investor I dont use any form of TA or stop losses etc, they make no sense for a fundamental investor IMO. (I am aware there are some investors that do find combining TA & FA works for them, it just makes no sense to me so I dont do it)
It's good that @DrBourse has a thread for beginners, but as you say, it's a bit long winded and rather one sided.
Given neither you nor I are beginners, we can only say what we have found to work for us, and that it doesn't involve market gymnastics.

So on topic I will propose a real life example of FA relating to contrarian investing.
REIT's are out of favour and generally have not recovered at the rate of most of the rest of the market.
REITs, like most market sectors are cyclical.
Contrarian investing is a bet against the prevailing market trend with a view to value (via increasing profit) returning.
Given that property prices typically increase over time, their lease rates will too, the reliability of the cycle to deliver a return is pretty good.
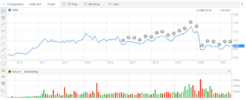
Choosing Cromwell as the stock we see this:
1627775470277.png
Keeping it simple, CMW is trading below its 2013 price, but now offers a stable dividend despite the pandemic.
Assuming a cycle rebound in years ahead, a +$1.30 target is in sight, representing an increase of over 40 cents/share (or 45%).
Given a current dividend yield of 8% and an NTA value of $1.00 any significant downside is likely to be well supported considering CMW has held above 80 cents throughout most of the pandemic.
There are many other metrics to consider, but the ones I look at most are those that could lead to CMW going belly up. As it stands CMW has no problem covering debt, and the rest depends on all the unknowns that can equally apply to every stock you look at.
 
Last edited:
All seems to be very complicated and long winded, I guess each investor needs to find a process they have conviction in, but that wouldn't work for me.

I can usually tell within 2 minutes of looking at a business whether its potentially investible (most are not), I would do a few hours research & analysis before taking a starting position if it looks like the business is investible based on my criteria.

There are some really good tools out there for helping with the process, I use Uncle Stock for screening and QuickFS is an invaluable tool for the quick assessment of investibility.

I developed my own spreadsheet for my process, its got much simpler over time, I work out ROIIC over at least 5 years, a quick and dirty FCF DCF to give me a range of valuation, some inversions/reverse engineering to understand what assumptions are needed for growth to underpin current price and what FCF is assumed in current price. It also checks margins, FCF yield and earnings yield. It all fits on one easy to use sheet.

EDIT - more posts made while i was writing this, as a long term investor I dont use any form of TA or stop losses etc, they make no sense for a fundamental investor IMO. (I am aware there are some investors that do find combining TA & FA works for them, it just makes no sense to me so I dont do it)

And some of us dont use and F/A at all.

There are many ways to achieve investment and profit.
 
Investing on your own? Here are three Intrinsic Value principles to live by….
Think of stocks as real business That's what they are: part-ownership in actual companies. When you buy shares in, say, Coles (ASX: COL), you become a passive owner of that company and have a right to a portion of its future profits, as well as a slice of every warehouse, cash register and unsold potato…..
Whether you own a bakery in partnership with your brother-in-law, or you own Coles in partnership with a million other shareholders, the principle is the same - think like an owner of a business, not a gambler speculating on what the share price will do next…..
Share Price does not equal value....
Extending the bakery analogy, imagine that your brother-in-law came to you every morning with an offer: a price he would be willing to pay for your share of the business, and a price at which he would be willing to sell you his. This is exactly how the stock market works - you own a slice of a real business and get a constant stream of offers from other shareholders.
The intrinsic value of a business is a function of all the cash it will receive, discounted back into today's dollars at a suitable rate of return. The market tells you the current price people are offering to buy and sell it. There's a big difference. I can offer to sell you a $10 note for $15, but that doesn't mean the note is worth more. Share prices bounce around far more than the value of the underlying businesses because share prices are dictated, at least in the short term, by human psychology.
If you're focused on the share price, rather than the business, you're going to make silly decisions. You wouldn't do this for your bakery: you'd care about how the bakery was doing at the end of each year - how much money it made, whether a new bakery opened next door, whether it needed to borrow cash etc - than what offer price your nutty brother-in-law comes up with.
Volatile share prices are a source of opportunity: If you have a firm idea of what your bakery is worth, when the offer price undervalues it, you can increase your ownership stake, and when it's too high, you can sell. A volatile share market gives you options, nothing more. You never have to act. Benjamin Graham first explained the idea that a wild stock market was advantageous to level-headed investors in his book The Intelligent Investor. He also developed this next philosophy, Build in a margin of safety.
No one knows what that future will look like. You can make some educated guesses based on a company's history, its competitive advantages, and forecasts about market growth and profitability. But ultimately you need to leave room for errors in your forecasts. If you do the sums and figure a company is worth $5.00 per share, that doesn’t mean you should buy aggressively when the share price hits $4.99. It might be better to wait for a wider discrepancy of 20-50% so that if something goes wrong, you aren't caught overpaying. A margin of safety won't eliminate mistakes, but it will swing the odds in your favour…..

A word of WARNING to the **FA** Newbies - An Intrinsic Value is not a TA call - Intrinsic Value Per Share is not a call on where the Share Price will go to - Intrinsic Value is basically what the company is worth Per Share, based on the company’s published Financial Statements - Basically if the company was ‘wound up’, then each shareholder should get that Intrinsic amount - they would not necessarily get the current Share Price.......
An IV can be calculated in numerous different ways – A correct and Valid IV relies a lot on what formulas are used, such as, DCFM, DDM, DDMF, PRESVAL, RIV, IVRR, NROE, CGVI, GIVF, BIVF – and there are numerous others - MAKE SURE YOU UNDERSTAND WHICH FORMULAS ARE BEING USED and what the implications are relating to each formula...Remember the old saying, “Garbage in = Garbage out”.......
DCFM = Discount Cash Flow Method, DDM = Dividend Discount Method, DDMF =Dividend Discount Method (Forward Return on Equity), PRESVAL = Calculates the Present Value of the Discounted Future Cash Flow per Share, RIV = Residual Income Valuation, IVRR = Intrinsic Value by Rate of Return, NROE = Normalised Return on Equity, CGVI = Comparative Growth & Value Indicator, GIVF = Grahams IV Formula, BIVF = Buffetts Balance Sheet IV........
Each Analyst/Broker has their own versions of “how to calculate an IV”.....for example –the Morgan Stanley ModelWare is a proprietary analytic framework that helps clients uncover value, adjusting for distortions and ambiguities created by local accounting regulations....... In ModelWare, EPS adjusts for one-time events, capitalizes operating leases (where their use is significant), and converts inventory from LIFO costing to a FIFO basis. ModelWare also emphasizes the separation of operating performance of a company from its financing for a more complete view of how a company generates earnings.......

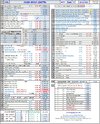
BOTTOM LINE HERE IS --- To use an IV correctly you MUST understand how it is calculated..... Personally, I have an Excel Spreadsheet that incorporates most of the above formulas...

The 1st snapshot below is the Data Entry Tab, then the next 2 snapshots show the results (by formulas), each analysis takes abt 30/45 minutes.
 

Attachments

  • 20210629 COL (1).jpg
    20210629 COL (1).jpg
    543.3 KB · Views: 74
  • 20210629 COL (2).jpg
    20210629 COL (2).jpg
    548.1 KB · Views: 53
  • 20210629 COL (3).jpg
    20210629 COL (3).jpg
    479.1 KB · Views: 54
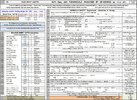
And here is an example of just one of those above IV Formulas (with an explanation).
 

Attachments

  • DDM Explanation.JPG
    DDM Explanation.JPG
    258.7 KB · Views: 80
Diversification is a “Nasty Word” as far as my Trading goes…
The word Diversification should be DIWORSEIFICATION…
Diversification will usually only Limit a Traders Profits…Diversification suggests that you should try to “limit or Average Down” your losses by “Spreading your Risk” through Investing or Trading in a range of Stocks from different Indicies, Groups, etc…
Diversification, as a Theory suggests for example, that you should use a % of your cash for one stock, then you should look for another stock in a different Indicie or Group, then repeat that process until you have the required numerous stocks…
So if you used 100% of your cash, and if you have say 10% in each of 10 different Indicies, Groups or Stocks, etc, Then half of your holdings drop in value, the other half may save your position by rising in value….. In this example the net result, in theory, could be a Zero Profit… Why on Earth would you do that, if for example, you feel that the first stock you bought was going to be very profitable, BUT, because of this ‘Magical word Diversification’ you now have to spread your Risk into stocks you may feel are not going to perform anywhere near as well as your first choice Stock… If I can only see one or two stocks that look positive for a short term trade, I will use all my available spare cash to trade those one or two stocks…
DIVERSIFICATION IS FOR INVESTORS…. .
The problem is that diversification can be a terrible form of risk management for the average share market investor. While it works well to reduce risk in a portfolio containing multiple asset classes, it’s not effective on a portfolio containing just shares.
Many ASX investors believe that by “diversifying” their share portfolio between 8, 10 or even 15 different companies they are reducing their “risk”, but this really isn’t accurate…..
"Wide diversification only guarantees ordinary results." - Charlie Munger….
Buying multiple ASX listed companies is a great way to prevent one “bad apple” from causing a game-ending loss (although it also prevents one great stock from significantly increasing your portfolio’s return), but what happens if the whole stock market falls? The answer is simple; your portfolio’s value will also fall….
 
Top