
- Joined
- 25 December 2018
- Posts
- 258
- Reactions
- 232


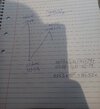


Too Much Information for me!!!Follow up post for Crude . Initially I was expecting a Low into the 28th but it appears to have come in as counter trend Top so if we continue to move down we could be Low on the 7th july then up till the 14th July for Top.
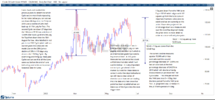
In this letter I will outline some methods and the approach I use to assemble a Forecast . Firstly it is important to determine where you are located within the market and in relation to the Fixed Cycles and Seasonal points on the Square of Nine . By studying past market movements and by deconstructing the swings you can gain a clearer insight as to what Cycle you are running against and the amplitude and duration of those swings. Gann kept several Master Forecasting Charts or Composite Charts for various stocks and commodities which is one of the key factors that allowed him to determine turning points in the market in conjunction with his other various methods. In order to properly understand and decipher what Gann was doing you will need to replicate his Charts and study his books in great detail not just a cursory glance like many people do . Page No 1 outlines the various Cycles which have been broken down into their various price and time components . The first swing down ran into the 20th Jul 2021 Low a decline of 15% in 14 days - the current swing down is around 7 days and 18% into the 22nd June 2022 Low so we have overbalanced the percentage decline but below the time period of 7 days . The second swing ran down 24% in 43 days - third swing ran down 12.69% in 27 days - fourth swing ran down 28.75% in 35 days and then the 2012 ten year Cycle ran down 30% in 119 days so it is important to compare these past time periods against the current position of the market to determine which one we are repeating . Like Gann I keep large Composite charts for various indexes and commodities which allows me to compare the amplitude and duration of past swings against current swings in the market . The notes below are a template however they do provide us with a good visual picture for comparison but the real value lies within the Master Charts which are constructed in a more sequential and clearly defined format . So getting back to the swings outlined on page 1 it is interesting to note that the 2018 swing measures 27 days in time which is very close to the 23 day time period projected out from the 14th June 2022 Top = 7th July where Low is indicated . If the trend does continue to move down into this date and breaks through the 22nd June Low we can use these percentage figures as an indication to the magnitude of the decline so by having a table of percentage decline figures at hand we can quickly calculate if the current swing down is balancing against any of these points as we approach the key Cycle dates . There are a few harmonic price points to watch and these are noted on the first page .
123.68 / 1.25 = 98.94
1/4 of 123.68 = 92.76
180 Deg in longitude on the Square of Nine = 103.50 so we are below the Square and in a position to move lower .
270 Deg or 3/4 around the Square = 93.50
360 Deg or a full revolution in price = 83.50
At this point these levels are only an indication and they could be helpful to monitor around the Cycle dates .
The Curve below contains four key reversal dates extending out till the end of July. As outlined previously the 28th June was an intermediate date and it appears that we could be counter trend Top into that date so if you are short at this point ensure that a time based stop is placed just above the 28th June Top price as price is required to stay below this point in order to qualify the Cycle down . If June 28th holds we could be down till the 7th July where Geo Mercury is at Max Nth Declination for a decline of 9 days which will balance against the previous time period into the 22nd June then we could be up till the 14th Jul for counter trend Top where an advance of 18.5 - 20.5% is indicated then down till around Fri 22nd or Mon 25th July for Low . The time between AB = 23 days which is fairly well balanced against the time period of 27 days from 2018 . If we hold below the 28th June Top a drop into the 7th July looks like quite a strong possibility so that is the current focus at present .
I also have current Forecasts of similar detail covering the SP500 Bitcoin Gold and a few other stocks . studentofgann.com.au
View attachment 143595
View attachment 143596
View attachment 143597
View attachment 143598

sorry i dont respond to moronsToo Much Information for me!!!
or are you on drugs
If not
Please explain your chart above
Does it say anything?View attachment 143604
I won't hold my breath!
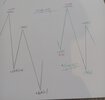
OEL Price at posting: 1.2¢ Sentiment: None Disclosure: Not HeldOk there are two scenarios that could play out so I have outlined two different Curves around the two key dates so keep your powder dry till the 7th July and hopefully a few days before that point we should be able to qualify whether the market is setting up for either top or bottom and we can trade out of the Cycle date in the prevailing direction of the market . I also have detailed Forecasts and a projected Low for Bitcoin and the SP500 on my website .
Crude Oil update :
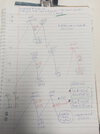
Here is an overview of the previous notes presented a few days ago . There are three Cycles outlined the first is the 2018 swing down into the 18th June Low a decline of 9.41% in 26 days which seems to be a close match to the current time period we are running out so we will come back to this model later in the piece . the second Cycle is 2019 which declined 26% in 105 days so the time period on this swing is far greater than the current 2022 swing which measures around 18% from the 14th June peak into the recent 22nd June Low . If we project a 26% decline down from 123.68 we get 91.53 which is a fair way off and would take us below the 11th April Low so we will just note this percentage decrease as a figure to monitor as we approach any future Cycle points . The third swing is from 2021 a decline of 16.75% in 45 days so the time period is greater than our 2022 projection which I will explain later . and we have already exceeded the percentage decline down to current levels . There are two dates that I am working with and I will try to construct a trading strategy around these two dates so we are looking at trading two swing points which will give us two sections of the market to trade . I would recommend waiting till the 7th July which is only a few days away and then we should have a clear indication as to how the market is setting up into this point . The first scenario is outlined in Curve 1 so if we run up into the 7th July we could be setting up for counter trend Top so if that scenario unfolds over the next few days I will look to refine the Cycle date and see if we can reduce it down to an hourly point but that is predicated on the market moving into a counter trend top on this date and the top will have to be higher than the 29th June to qualify. If this scenario plays out we could be down till the 14th July for Low which is interesting as the time period on the first swing down measures 8 days and the second leg down into the 14th July balances against this count also for a cumulative peak to trough decline of 30 days in between AB which is very close to the 2018 time period of 26 days so there is a chance we could be repeating this pattern so keep your powder dry till the 7th July and we should have a clearer picture at that point . The second scenario is a Low into the 7th July then up till the 14th July for counter trend Top then down till the 8th or 14th August for Low which is in line with previous Lows . If you go back and look at the previous campaigns you will find that August was a Seasonal month for Lows so there is a good chance main trend will be down into one of these dates. If we do get Low into the 7th July we should be up till the 14th July then roll over into August Lows as detailed on the Curve. The time period for this projection measures 23 days which is also very close to the 2018 model at 26 days so it would be prudent to wait a few more days to see which Curve the market is running against . Notice the counter trend Top periods outlined in orange pen are 9 and 10 days which is fairly close to the current counts and also note the percentage increase outlined in green pen is around 13.5% on both swings so I have projected this price up from the 101.53 Low and it equals 115.70 so this price will balance the amplitude of the last two Cycles which will provide us with a gauge if we do move up into the 7th July for counter Top . 101.53 + 1/2 Square = 111.79 we are above this point - 101.53 x 1.125% = 114.22.
Was initially looking for a Low into this date however it appears the 28th could be counter trend Top . Price calculations listed below .
View attachment 143413

Alliance of the useful : BRICS, the Arab League, OPEC, the Shanghai Cooperation Org, the Eurasian Economic Union, and don't forget the African Union.It looks as if WTC and Brent are about to take a journey above $100 pb again after the muppets at OPEC+ decided to put pressure on the Western nations to assist their partner in evil, Russia.
“There is a belief in Saudi Arabia that the US won’t create a major kerfuffle over higher oil prices, unless they really get out of control,” says Eurasia Group’s Alkadiri. “But when you’re playing with a global superpower that can come back to bite you.”
running out , or running out of land to explore , Biden was putting all sorts of pro-Climate Agenda regulationsOil is on a run up again after OPEC+ announced cuts in production.
The US which is running out of shale oil presently seems powerless to exert any pressure on the Saudi cousins.
From the Financial Times.
gg
To my understanding there's an element of both.running out , or running out of land to explore
Just when you think we are finally running out of oil, up pops something to extend its life.The U.S. shale revolution dramatically reshaped the world energy markets. The shale boom was one of the most impressive growth stories, from take off in 2008 to the Permian stealing the mantle from Saudi Arabia’s Ghawar as the world’s highest producing oilfield in a little over a decade. Overall, Reuters has estimated that, “U.S. petroleum production is at least 10-11 million bpd higher than it would have been without horizontal drilling and hydraulic fracturing.’’
“There’s just a lot of oil being left in the ground. Fracking’s been around for a really long time, but the science of fracking is not well understood,” Exxon Chief Executive Officer Darren Woods said Thursday at the Bernstein Strategic Decisions conference. Woods has revealed that Exxon is currently working on two specific areas to improve fracking. First off, the company is trying to frack more precisely along the well so that more oil-soaked rock gets drained. It’s also looking for ways to keep the fracked cracks open longer so as to boost the flow of oil.
Shale Refracs
Luckily, the U.S. Shale Patch won’t have to wait for Exxon to perfect its new fracking technologies. There's already a proven technology for oil producers to return to existing wells and give them a second, high-pressure blast to increase output for a fraction of the cost of finishing a new well: shale well refracturing.
Refracturing is an operation designed to restimulate a well after an initial period of production, and can restore well productivity to near original or even higher rates of production as well as extend the productive life of a well. Re-fracking can be something of a booster shot for producers--a quick increase in output for a fraction of the cost of developing a new well.
While refracturing has never really gone mainstream, the technique is seeing higher adoption as drilling technology improves, aging oilfields erode output, and companies try to do more with less. According to a report published in the Journal of Petroleum Technology, new research from the Eagle Ford Shale in south Texas shows that refractured wells using liners are even capable of outperforming new wells despite the latter benefiting from more modern completion designs.
JPT also estimates that North Dakota’s Bakken Shale straddles some 400 openhole wells capable of generating an excess of $2 billion if refractured. Mind you, that estimate is derived from oil prices at $60/bbl vs. this year’s average oil price of almost $90/bbl. According to Garrett Fowler, chief operating officer for ResFrac, a refrac can be up to 40% cheaper than a new well and double or triple oil flows from aging wells.
I seem to recall that about 20 years ago the doom sooth sayers were predicting the end is neigh to petroleum production. it was only downhill from there.An Interesting article on fracking from Zero Hedge
Just when you think we are finally running out of oil, up pops something to extend its life.
For how long though is the question.
Mick
We use cookies and similar technologies for the following purposes:
Do you accept cookies and these technologies?
We use cookies and similar technologies for the following purposes:
Do you accept cookies and these technologies?