Australian (ASX) Stock Market Forum

Can trading platforms change the value of candles that have already closed?

Joined
2 July 2024
Posts
3
Reactions
4
Hi Everyone
I've been following the stock market for a few years now and on the platform I use I constantly notice that the HLOC of candles is getting changed sometimes 30 minutes after that bar has closed. This often happens on the ASX open of certain stocks.
For example after the close of the 10.05 candle the bid high might be 148.140. When I check 30 minutes later it can say bid high for 10.05 candle 148.540. This also happens in much larger variations but I'm just giving a basic example. This also means the historical value for the ATR is changing as the bars it's derived from have changed.
I have asked on my trading platforms forum a couple of times and provided screenshots but never heard back from anyone.
I'm confused as to how any trading plan that I work on can be accurate if the historical information I'm basing it on can be changed.
Is this normal or has anyone else experienced this?
I would love to finally figure this out so if any of you have any insight that would be greatly appreciated
Thanks
Ryan

Also apologies and please let me know if i have posted in the wrong area
Hi Ryan,

Tried to send the following by Private Conversation - don't think it worked..

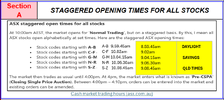
The following snapshot may help explain why OHLC figures change Outside Normal Trading Hours.

1731458626560.png

Perhaps you should check @ 4.09.59pm, and then again just after 4.10pm.
A Search of the ASX Site for "Pre-CSPA" may disclose something similar..

Cash market trading hours

That Snapshot of mine is abt 20years old.
Cheers.
DrB
 
As above, the ASX website data is delayed by 20 minutes, other providers might take another 10 minutes to distribute non live data.

Further, there's the 2* exchanges,- so there's ASX data and Chi-X data.
I guess it's possible that changes are incorporating both exchanges data.

I've noticed that Comsecc give live combined data on the main page of a stock. If one goes into an order page, it will only display ASX market depth though.

Your question is probably best to name your broker here though and someone might know specifics for that broker, or enquire directly to your broker.
I can't say about candles changing though, but if there's that much change to a candle, it suggests low volume volatility and wide market depth.

* Actually 3 exchanges now including NSX, but I think they might be struggling to get a foothold and probably not worth including here for confusion purposes.
 
@Ryanair737 when you see one that has changed, check the trade data at 4:11 pm which will give you the normal hours trade. Then check that data after 4:30pm. If there is a change you will find that it is an after close trade. I have done after close trades when my broker has one of his other clients wanting to sell/buy ar an agreed price in that half hour window.
EDIT: I was under the impression that these trades should not be included in the day's data but each data provider seems to differ somewhat
 
Hi everyone,
Thank you so much for your replies!
I guess the thing I'm getting at is say for example I had a stop loss set to close a position at 142.10 and at 10.30am I looked and see that the lowest price got to since the market opened was at 10.08am when it hit 141.90 then I would imagine that my stop was hit and then position would automatically be closed.
Then if i check again at 2pm and it now says that the lowest price of the day was at 10.08am when the price hit 142.30, which is correct? Did the position close or not? I didn't actually have this trade set but I'm just trying to give an example.
Unfortunately I didn't take any screenshots today as that would have explained it in much better detail. I assume this issue also happens with UK stocks on the platform I use so once the market opens I'll check for any discrepancies and if so I'll take some screenshots and post them here. If it turns out to solely be an ASX issue on the platform then I will wait till tomorrow morning and take/upload some screenshots then.
I currently have an IG Trading account and I have emailed them a couple of times and post on the forum there but strangely got no reply.
Thanks again for everyone's feedback
Ryan
 
If there was enough volume to close all positions at that specific time then yes
You may not have been filled if there wasn’t enough buy volume to fill ALL sellers at that level at that time.
It could have traded there but you may not have been filled
Happens to me on both sides so your not alone !
Annoying when you get it right and the trade takes off either way and your stranded.

A good friend of mine said
“ Don’t be a dick for a tick “
Meaning if you want to sell it sell it
Buy it buy it.

But if you not staring at a screen——
 
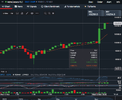
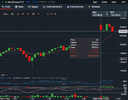
So I managed to find it happening with Astrazenica as the market opened yesterday evening and took some screenshots. I couldn't get away form work for the ASX opening unfortunately.
I took a screenshot at 19.20 and you can see the HLOC data for that period and also see that the 19.00 5 minute candle had a large green body. When I took another screenshot 5 minutes later at 19.25 the HLOC data and candle formation have completely changed for the for the 19.00 candle.
Maybe it has already been explained in that sense and if so I apologies.
Ryan
 

Attachments

  • astra bid 19.20.png
    astra bid 19.20.png
    123.6 KB · Views: 6
  • astra bid 19.25.png
    astra bid 19.25.png
    115 KB · Views: 6
It look like the first bar is using the previous day close as the open price. Then it corrects to the proper open price sometime later.

It's probably a small error in the charting software that causes this anomaly. A right royal pain if your trading the 5min opening range and it's incorrect.
 
Top