- Joined
- 10 December 2014
- Posts
- 27
- Reactions
- 0
Hey ASF'ers,
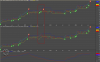
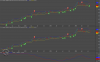
I am considering implementing a sell signal in my trading plan, to sell when the MACD crosses below the signal line.
I believe I may be thrown out too often with this rule however?
Is there a good volume indicator I can implement with this rule, that will help me disregard the macd crossover below the signal line IF the pullback is on low volume?
I would love to test this out in real time, however my first filter is to stay out of the market when XJO is trading below 50 SMA...Yawn!
")