tech/a
No Ordinary Duck
- Joined
- 14 October 2004
- Posts
- 20,447
- Reactions
- 6,477
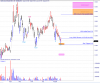
SPI 1 Min CHARTS
This is a trade today of around 40 mins.
I place it as a working example --- I took shots through the trade to make notes on later and to show the analysis during the trade.
I had 2 contracts which returned $1050 for the trade in 40 mins.
I didn't trade again for the day as I was busy with business.Missing a great move up.
If you have a 1 min SPI chart and digest my notations on the trade shown--you'll see you would have got pretty well all of it!
Futures are different to stock
We have buyers and sellers of longs
and buyers and sellers of shorts
Influencing price direction.
(1) We look for effort----VOLUME
(2) What is it TRYING TO DO?
(3) Is it SUCCEEDING
(4) Trade accordingly.
Now I posted at the time (Close to it) That I took the trade and at the time I exited so those who want time stamps can check credibility.

THEN
View attachment 44172
THEN
 SORRY THE DOWNLOADING PUTS THE CHARTS OUT OF SEQUENCE
I think you can follow?
THEN

THEN

This is a trade today of around 40 mins.
I place it as a working example --- I took shots through the trade to make notes on later and to show the analysis during the trade.
I had 2 contracts which returned $1050 for the trade in 40 mins.
I didn't trade again for the day as I was busy with business.Missing a great move up.
If you have a 1 min SPI chart and digest my notations on the trade shown--you'll see you would have got pretty well all of it!
Futures are different to stock
We have buyers and sellers of longs
and buyers and sellers of shorts
Influencing price direction.
(1) We look for effort----VOLUME
(2) What is it TRYING TO DO?
(3) Is it SUCCEEDING
(4) Trade accordingly.
Now I posted at the time (Close to it) That I took the trade and at the time I exited so those who want time stamps can check credibility.
THEN
View attachment 44172
THEN
SORRY THE DOWNLOADING PUTS THE CHARTS OUT OF SEQUENCEI think you can follow?
THEN
THEN