- Joined
- 13 February 2006
- Posts
- 5,193
- Reactions
- 11,917
A number of gold charts have appeared:
@rederob
Still bullish.

@Cam019
Bearish.

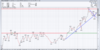
I am also bearish currently. First up just a straight 10yr chart. Just looks weak.

The Miners: also looking weak. At one point we did extend through the resistance, but it failed.

As against interest rates. 16yrs worth of chart. Gold has always inversely correlated against yield. Yield is rising. You would expect gold to fall unless real yields were still negative as against PPI rather than CPI. The question is where do yields fail, if/when the Fed. steps in front of them. At 0.10 level or 0.261 level?


Just run too far too fast.
This chart also looks bearish. The last 10yrs.

As against debts:

I think gold grinds lower most of the year, fighting all the way as true believers buy the multitude of dips on the way down. That can reverse, but it will take (a) a surge in PPI inflation and (b) Fed. capping rates. Can that happen? Of course, I even have it as probable. So a short term bear, long term bull.
jog on
duc
@rederob
Still bullish.
@Cam019
Bearish.
I am also bearish currently. First up just a straight 10yr chart. Just looks weak.
The Miners: also looking weak. At one point we did extend through the resistance, but it failed.
As against interest rates. 16yrs worth of chart. Gold has always inversely correlated against yield. Yield is rising. You would expect gold to fall unless real yields were still negative as against PPI rather than CPI. The question is where do yields fail, if/when the Fed. steps in front of them. At 0.10 level or 0.261 level?
Just run too far too fast.
This chart also looks bearish. The last 10yrs.
As against debts:
I think gold grinds lower most of the year, fighting all the way as true believers buy the multitude of dips on the way down. That can reverse, but it will take (a) a surge in PPI inflation and (b) Fed. capping rates. Can that happen? Of course, I even have it as probable. So a short term bear, long term bull.
jog on
duc