tech/a
No Ordinary Duck
- Joined
- 14 October 2004
- Posts
- 20,417
- Reactions
- 6,356
There is a lot of confusion with regard to reading volume.
I'll attempt to make it as clear as crystal for those struggling.
To do so we will have to construct the very essence chart reading and indeed technical analysis---Regardless of the form of analysis---all will be come clear.
All trading is governed by Support and Resistance.
If we trade trends we expect and look for price to break resistance.
If we buy pull backs we expect support to hold so we can jump on a trend.
We sell when we believe resustance will hold and price will not rise further.
If we trade short we look for support to be broken and we look to buy back when we believe support will return.
So whether it be Bollingers,Elliott,RSI Stochastic,trendlines or Volume its support and resistance we seek.
So to Reading volume
Reading volume is all about SUPPLY.
(1) Supply either dries up OR
(2) Supply is overcome by demand.
The big problem for everyone is identifying volume as (1) OR (2)
There are a few ways of doing this.
You can read volume like T/H.
You can look at lower timeframes Daily to 30 min for example.
But for those who cant or dont have access to either of these the answer is simple.
You CANT tell if volume is Drying up or being absorbed until further Bars show you the answer.
Remember price CANNOT MOVE UP unless supply has been exhausted--EITHER from being withdrawn OR over powered by buying
Lets take a look at a classic example

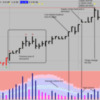
Here we can follow each bar and actually see volume dry up.
Clearly it is absorbed and sellers leave the market---at this level.(Where the volume is)
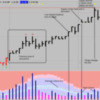
So now lets see what happens further along in the chart (Its HGO if you hadnt noticed.)

Is that clearer now??
I'll attempt to make it as clear as crystal for those struggling.
To do so we will have to construct the very essence chart reading and indeed technical analysis---Regardless of the form of analysis---all will be come clear.
All trading is governed by Support and Resistance.
If we trade trends we expect and look for price to break resistance.
If we buy pull backs we expect support to hold so we can jump on a trend.
We sell when we believe resustance will hold and price will not rise further.
If we trade short we look for support to be broken and we look to buy back when we believe support will return.
So whether it be Bollingers,Elliott,RSI Stochastic,trendlines or Volume its support and resistance we seek.
So to Reading volume
Reading volume is all about SUPPLY.
(1) Supply either dries up OR
(2) Supply is overcome by demand.
The big problem for everyone is identifying volume as (1) OR (2)
There are a few ways of doing this.
You can read volume like T/H.
You can look at lower timeframes Daily to 30 min for example.
But for those who cant or dont have access to either of these the answer is simple.
You CANT tell if volume is Drying up or being absorbed until further Bars show you the answer.
Remember price CANNOT MOVE UP unless supply has been exhausted--EITHER from being withdrawn OR over powered by buying
Lets take a look at a classic example

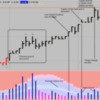
Here we can follow each bar and actually see volume dry up.
Clearly it is absorbed and sellers leave the market---at this level.(Where the volume is)
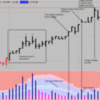
So now lets see what happens further along in the chart (Its HGO if you hadnt noticed.)

Is that clearer now??


