Australian (ASX) Stock Market Forum

Well old Wazza been unloading mega to cash lately so you might want to revise that quote . I got a feeling he learnt from GFC where BRK lost 55% , not happening again . . Dont know the exact figure but BRK got to be way more than 50% cash at this very moment . Edit ok seems like he is about 30% cash atm , my mistake


https://www.tortoisemedia.com/2024/08/09/a-buffetting-wind/#:~:text=The CEO of Berkshire Hathaway,holds $277 billion in cash.View attachment 182343
AAPL is very expensive currently. I would suggest BRK sold mainly due to this reason and can't find anything currently worth buying to replace it. Another GFC? Yes, BRK would go down the same again. They are not going to sell all their equities.
 
AAPL is very expensive currently. I would suggest BRK sold mainly due to this reason and can't find anything currently worth buying to replace it. Another GFC? Yes, BRK would go down the same again. They are not going to sell all their equities.
Berkshire sold some other stuff as well but not to the $value of AAPL and maybe Berkshire has done what i do ( take MY investment cash out , and let the profits run )

does anyone know the average buy-in price of AAPL paid by Berkshire it might be up more than 200% for them they have held some for years and if we have a major trade war with China , AAPL will get hurt ( as will companies like Samsung )
 
I'd say Charlie Munger used to pull a lot of the big money shots in BRK, and he's no longer with us. I personally think Buffet is full of it, he's got money because he's a cunning scavenger, when he bought Freo Cranes in Australia he made every worker use their credit card for work related accommodation and cut many pays.
 
I just dont get this obsession with Buffet/BRK . Sure between 1980 and 2000 Buffet was an investing god but thats long over . Data will set you free from misconceptions , cult members have zero objectivity . I am not posting anymore comparison charts , i am not pointing out BRK sold down as much as SPX in gfc . None of that matters to cult members . Ive done all this many times over the years and the cults eyes just glaze over and filter that out . I contemplated blocking all cult members but there might be less than 20% of posts left to see 🤣 . AND as many threads in here end up , so far of topic its crazy , yeah i am guilty of that as well
 
I just dont get this obsession with Buffet/BRK . Sure between 1980 and 2000 Buffet was an investing god but thats long over . Data will set you free from misconceptions , cult members have zero objectivity . I am not posting anymore comparison charts , i am not pointing out BRK sold down as much as SPX in gfc . None of that matters to cult members . Ive done all this many times over the years and the cults eyes just glaze over and filter that out . I contemplated blocking all cult members but there might be less than 20% of posts left to see 🤣 . AND as many threads in here end up , so far of topic its crazy , yeah i am guilty of that as well
Sorry to be off topic but I've been in to the NASDAQ these past 12mo. though out for just over a month and this post caught my eye.

The main reason Buffet/BRK is in the news atm is that he is selling down $Gazillions of AAPL thus releasing stock which for some reason means ETF's and Funds have to rearrange the percentage of holdings in AAPL which will affect the share price and by extension the market in other stocks. This will affect the NASDAQ and other indices.

gg
 
I just dont get this obsession with Buffet/BRK . Sure between 1980 and 2000 Buffet was an investing god but thats long over . Data will set you free from misconceptions , cult members have zero objectivity . I am not posting anymore comparison charts , i am not pointing out BRK sold down as much as SPX in gfc . None of that matters to cult members . Ive done all this many times over the years and the cults eyes just glaze over and filter that out . I contemplated blocking all cult members but there might be less than 20% of posts left to see 🤣 . AND as many threads in here end up , so far of topic its crazy , yeah i am guilty of that as well
well yes , Berkshire has developed a cult of personality , and Warren has thrown out years of simple and successful tips , but that is just very clever advertising , fancy a billionaire financier/predator that does You-Tube videos on buying McDonalds for breakfast on the way to the office ( instead of flashing a designer watch at some meeting )

but sure sort through the hundreds of wisdoms and use the ones YOU can make work for YOU

for example some like high turnover of holdings , but i buy into ' a business ' ( and prefer to hold some of it , forever , or not at all )

but in Australia div. investing can be nicer than chasing capital gains ( the reverse seems to be so in the US )
 
Sorry to be off topic but I've been in to the NASDAQ these past 12mo. though out for just over a month and this post caught my eye.

The main reason Buffet/BRK is in the news atm is that he is selling down $Gazillions of AAPL thus releasing stock which for some reason means ETF's and Funds have to rearrange the percentage of holdings in AAPL which will affect the share price and by extension the market in other stocks. This will affect the NASDAQ and other indices.

gg
indeed it will , although that should not impact my holdings much as i have very little US direct exposure ( similar to my China exposure )

however the China exposure may change during the week ( market moves permitting )
 
We'll try to go back on topic, sort of :D .

The Aussie market on average is definitely underperforming in the long term.

View attachment 182384
Total returns / accumulation index only way to compare returns in this scenario , BRK paid dividends only once and that was voted on while Buffet was on toilet " apparently" :D apples to apples please , oranges got nothing to do with it . Thats the chart of a cult member
 
Total returns / accumulation index only way to compare returns in this scenario , BRK paid dividends only once and that was voted on while Buffet was on toilet " apparently" :D apples to apples please , oranges got nothing to do with it . Thats the chart of a cult member
Some stocks in all indexes never pay a dividend end throughout their entire life though, even the ones that do the SP usually discounts by the div amount when they go to ex div. Pretty sure one of his protocols was to not buy companies that pay divs but rather invest the money back into the company for further growth.

I'm definitely not a Warren cult member, I think his wealth is mainly 70% luck and he was smart enough to be an early adaptor of stock markets. There is bigger growth in most top US stocks than there is here overall. Just to make myself clear, if you were sensible when he started trading you couldn't really lose overall.
 
We'll try to go back on topic, sort of :D .

The Aussie market on average is definitely underperforming in the long term.

View attachment 182384
and that is good thing if you are hunting for fair value in the current markets , there are some near reasonable prices without being perennial flea-bags

for instance recent buys ( the last three months ) included RMC and SRG
 
if you were sensible when he started trading you couldn't really lose overall.
Firstly BRK total return is reflected in the share price but DJI and XAO are not as they pay regular annual divs . making your implied returns above redundant . on TV use DJITR or SPXTR , not sure there is an ASX total return on TV with data that far back but it is accessible elsewhere on net , google is your friend there

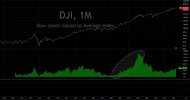
Well the period 1980 - 2000 was one of the largest 20 year runups ever ( might well be the largest tbh, havent checked ) and it made the Turtles look better than they were and possibly Buffet . Rough patches determine greatness in markets imo .

Couldnt help myself had to check and yes 1980 to 2000 strongest 20 years by multiples

The Green pane is the runup from 20yr lows as percent fwiw . My code so not a builtin on TV
ScreenShot1251.jpg
 
Last edited:
This is the S&P 500, not a total return index. I bet if you got the top US and Au stocks over 50 years and compared total returns they would still beat us hands down.


View attachment 182401
No doubt about that:
Australia has the second highest company tax in the world after Columbia.
That is enough to ensure a constant underperformance, then add the various colour tapes , H&S, organised crime/CFMEU bribes for some sectors and our political leaders tending to pretend they know better in science and engineering: look at energy costs, etc.
We are an uncompetitive economy and our stock market pays the price.
Luckily for us, the QE, global monetary bubble and some ATO rulings: CGT discounts, super taxation and mandatory investing, franked dividends twist the balance back a bit in favour of shares
Long gone the days when markets were mirroring the underlying economy,until the next reset..
 
We'll try to go back on topic, sort of :D .

The Aussie market on average is definitely underperforming in the long term.

View attachment 182384
Thanks @TimeISmoney , and just to completely bring us back on track the title of the thread is

XAO TECHNICAL ANALYSIS
So with that in mind I did some charts of the XAO , long , medium and short term using 10 year monthly, 5 year weekly and YTD daily timeframes and some simple moving averages of varying lengths to try and decide whether the recent pullback might make it necessary for those of us who enjoy spending money to withdraw from supporting the muppets at the ASX or maybe pile a bit more money on in anticipation of a good bull run to 10,000. The SMA's are just appropriate to the timeframes and you can do your own as you wish or other MA's such as EMA.
Also can replies leave out the following words if possible.
1. Free carry
2. I bought at
3. Apple
4. Berkshire
5. Recent buys
6. US or China
7. I once
And finally
8. The names Warren and Charlie.

It is a TA thread which is technical and words such as the above have no place in a technical thread on the XAO.
So here are the charts going from longterm to medium to short, with a commentary under each chart.
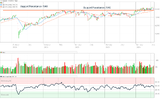
xaomo10y.png
A long term chart showing a nice Support/Resistance line at about 7840 which is close to where we were at last week. I feel any significant break through this downwards should give cause for pause. The 50 and 200 SMA are moving in unison and the 50 was only breached down by price during the first year of Covid. Even the RSI looks harmless not suggesting any divergence nor oversold nor overbought. On the face of it there is no need to panic just on this chart as generally there has been a gradual bullish move gaining 60%. There were a few lost years though and large sell offs and those prone to panic and hope would have been hammered.


xao5yrwkl.png

Here it can be seen that a full 18 mo. after Covid in July 2021 the recovery stalls at the resistance line 7840. I'm using a SMA of 15 and 40 and price then ranges between about 6640 and 7840. This is a gain of approx 18% which is ok from Aug 2019 before Covid to say April 2021 but then it tails off down to about 6700 later that year. The whole run of the ASX since then until January this year has been pretty lousy really. Could any technicals have helped. Not the SMA's, as they followed but didn't signal between each other nor price. When they appeared to there followed whipsaws rather than a clean break above 7840. So at best you would have made a gain of 20%. The RSI did show some divergence from July to Dec 2021 which an astute investor may have used to exit but where to re-enter would have been problematic. So an investor entering at Aug 2021 would have gained nothing to the beginning of this year when the XAO broke up through 7840 which brings me to the next chart.


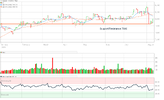
xaoYTDdaily.png

The YTD dally chart over 8 mo. shows not much of a gain following last week's falls. The MA's are a 10 and a 30 SMA's. Will it fall further. It is just on the medium term support again at 7840. If it holds and bounces up could this be the bull run we have all been waiting for. Will it sink? The MA's again have not been very helpful as when ever there was a signal getting out and in for the next crossover signal made no profit.. The rise in March diverged with the RSI in late March but on other price movement I would have ignored it. Price action with steady volume would indicate that not much will happen until it does. Anyways it's not the end of the world and if the XAO does move up and even if it doesn't I'm cashed up again and will continue investing on the ASX.

All in all I found the Support/Resistance line at 7840 to be the best of all the technical indicators for the XAO apart from just "follow the trend" when it moved up or "panic" when something like Covid happens.

gg
 
We'll try to go back on topic, sort of :D .

The Aussie market on average is definitely underperforming in the long term.

View attachment 182384
Thanks @TimeISmoney , and just to completely bring us back on track the title of the thread is

XAO TECHNICAL ANALYSIS
So with that in mind I did some charts of the XAO , long , medium and short term using 10 year monthly, 5 year weekly and YTD daily timeframes and some simple moving averages of varying lengths to try and decide whether the recent pullback might make it necessary for those of us who enjoy spending money to withdraw from supporting the muppets at the ASX or maybe pile a bit more money on in anticipation of a good bull run to 10,000. The SMA's are just appropriate to the timeframes and you can do your own as you wish or other MA's such as EMA.
Also can replies leave out the following words if possible.
1. Free carry
2. I bought at
3. Apple
4. Berkshire
5. Recent buys
6. US or China
7. I once
And finally
8. The names Warren and Charlie.

It is a TA thread which is technical and words such as the above have no place in a technical thread on the XAO.
So here are the charts going from longterm to medium to short, with a commentary under each chart.
View attachment 182397
A long term chart showing a nice Support/Resistance line at about 7840 which is close to where we were at last week. I feel any significant break through this downwards should give cause for pause. The 50 and 200 SMA are moving in unison and the 50 was only breached down by price during the first year of Covid. Even the RSI looks harmless not suggesting any divergence nor oversold nor overbought. On the face of it there is no need to panic just on this chart as generally there has been a gradual bullish move gaining 60%. There were a few lost years though and large sell offs and those prone to panic and hope would have been hammered.


View attachment 182398

Here it can be seen that a full 18 mo. after Covid in July 2021 the recovery stalls at the resistance line 7840. I'm using a SMA of 15 and 40 and price then ranges between about 6640 and 7840. This is a gain of approx 18% which is ok from Aug 2019 before Covid to say April 2021 but then it tails off down to about 6700 later that year. The whole run of the ASX since then until January this year has been pretty lousy really. Could any technicals have helped. Not the SMA's, as they followed but didn't signal between each other nor price. When they appeared to there followed whipsaws rather than a clean break above 7840. So at best you would have made a gain of 20%. The RSI did show some divergence from July to Dec 2021 which an astute investor may have used to exit but where to re-enter would have been problematic. So an investor entering at Aug 2021 would have gained nothing to the beginning of this year when the XAO broke up through 7840 which brings me to the next chart.


View attachment 182399

The YTD dally chart over 8 mo. shows not much of a gain following last week's falls. The MA's are a 10 and a 30 SMA's. Will it fall further. It is just on the medium term support again at 7840. If it holds and bounces up could this be the bull run we have all been waiting for. Will it sink? The MA's again have not been very helpful as when ever there was a signal getting out and in for the next crossover signal made no profit.. The rise in March diverged with the RSI in late March but on other price movement I would have ignored it. Price action with steady volume would indicate that not much will happen until it does. Anyways it's not the end of the world and if the XAO does move up and even if it doesn't I'm cashed up again and will continue investing on the ASX.

All in all I found the Support/Resistance line at 7840 to be the best of all the technical indicators for the XAO apart from just "follow the trend" when it moved up or "panic" when something like Covid happens.

gg
 
Top