michaelananya
Old dog
- Joined
- 27 April 2018
- Posts
- 14
- Reactions
- 3
Are there any Tradingview screener setups for identifying “stocks in play “ for day traders ( free or paid) ?
Thanks
Thanks
Peter would you mind having a look at intraday volume and figure out how they colour the bars? That's really the point of my question. It appears as though they are often coloured incorrectly. Thanks.Try this.

Had a look at the intra-day volume colours and didn't find any mistakes. The dojis are coloured green (up) although the close is the same as the open, but I don't consider that incorrect. I haven't used the other colouring options or changed the precision parameter.
I did notice this impulsive move on MYR with all the series of ascending triangles since the earnings report. Who'd have thought MYR would act like a young buck.
View attachment 93650
Oh yeah right! Now I am confused, shouldn't they just for contract differences or am I doing wrong on ninja trader?@Roller_1 I do have live futures data in TradingView, and that check box is not available.
Yeah but then all the levels are up to ****, over one contract roll it might not make too much difference, but if you're going back three or four then the charts are going to be a fair bit out.It’s the same once you add the no gaps candles @Roller_1

 adamhgrimes.com
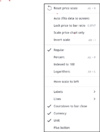
Try a Right Mouse Click on the Price Scale, then either select Reset Price Scale, or perhaps make your selections the same as the attached snapshot.Can anyone help me out. For some reason the scale in trading view has these weird denominations. It must be a simple setting somewhere but do you think I can find out what it is… Anyone know how to get this back to normal decimal points.
View attachment 139977

Yeah I have tried that, and adjusted all those settings but it is still the same. I tried the settings the same as yours but still getting the weird denominationsTry a Right Mouse Click on the Price Scale, then either select Reset Price Scale, or perhaps make your selections the same as the attached snapshot.
View attachment 139978
NUP can't see any other options except to select the "3 dots" at top right, then select "Help & Feedback", then select "Send Feedback".hmmmmm - still looking
Hello and welcome to Aussie Stock Forums!
To gain full access you must register. Registration is free and takes only a few seconds to complete.
Already a member? Log in here.