Australian (ASX) Stock Market Forum

Top Daily Stocks - Possibles, Probables and Fakers...

Just for the point of the exercise and trying to clarify how I might use some of the "Volume" data which is posted.

The data in itself provides nothing more than questions as to whether any further research may be warranted.:bookworm:

I am currently fully invested so I am not particularly looking for more "Specs with potential", but that was what I had in mind when originally posting the data which I myself would often look at.

With that all said, below will hopefully be a very rough and quickly set up spreadsheet with today's "Volume" Stocks under approx $200 Million Market Cap to demonstrate basically what I am babbling about.:bored:

Personally I was/am more interested in the VERY low Market Cap Stocks of less than $20 million, but that is up to each punter to determine their areas of interest.

So in the rough look Chart below, I initially look for various things of interest:

Cash on hand;
Cash on hand in relation to Market Cap;
Charts
(I like charts that have been punished but showing some signs of possible revival off recent lows);
Sector (I like Mining Stocks but not Financial or Energy Specs);
Volume in relation to normal and market cap (Increase in Volume relative to price action is always a tell tale of something going on);
News/Announcements which precede or post"cede" Volume or price action.

As an example today RC1 chart went ballistic of recent lows off the back of some "apparently" stellar RC drill results. At face value the results look fantastic, but a closer look indicates (to me), that the strikes are VERY "nuggetty"

Nuggetty Gold is obviously not a bad thing, but many times the follow up drilling around nuggetty deposits is far less spectacular.

Couple that, with the price spike coming off an obviously distressed Chart, then I would put a strike through RC1 with no further research at this point, or at least till the initial Chart euphoria wears off and perhaps some more results come to hand.

That is just one example, but in reality, it took me 20 seconds to cull that Stock from any further current research, and that is the concept of how I would use the data posted. Others may or may not find the data useful at all, particularly if Specs are of little interest.

Cheers, and hopefully that helps or makes some sense. (Please click to expand below. Stocks either get a NAH or a possible further research if showing signs of potential):photogenic:
 

Attachments

  • 2022-07-06.png
    2022-07-06.png
    457.7 KB · Views: 9
Just for the point of the exercise and trying to clarify how I might use some of the "Volume" data which is posted.

The data in itself provides nothing more than questions as to whether any further research may be warranted.:bookworm:

I am currently fully invested so I am not particularly looking for more "Specs with potential", but that was what I had in mind when originally posting the data which I myself would often look at.

With that all said, below will hopefully be a very rough and quickly set up spreadsheet with today's "Volume" Stocks under approx $200 Million Market Cap to demonstrate basically what I am babbling about.:bored:

Personally I was/am more interested in the VERY low Market Cap Stocks of less than $20 million, but that is up to each punter to determine their areas of interest.

So in the rough look Chart below, I initially look for various things of interest:

Cash on hand;
Cash on hand in relation to Market Cap;
Charts
(I like charts that have been punished but showing some signs of possible revival off recent lows);
Sector (I like Mining Stocks but not Financial or Energy Specs);
Volume in relation to normal and market cap (Increase in Volume relative to price action is always a tell tale of something going on);
News/Announcements which precede or post"cede" Volume or price action.

As an example today RC1 chart went ballistic of recent lows off the back of some "apparently" stellar RC drill results. At face value the results look fantastic, but a closer look indicates (to me), that the strikes are VERY "nuggetty"

Nuggetty Gold is obviously not a bad thing, but many times the follow up drilling around nuggetty deposits is far less spectacular.

Couple that, with the price spike coming off an obviously distressed Chart, then I would put a strike through RC1 with no further research at this point, or at least till the initial Chart euphoria wears off and perhaps some more results come to hand.

That is just one example, but in reality, it took me 20 seconds to cull that Stock from any further current research, and that is the concept of how I would use the data posted. Others may or may not find the data useful at all, particularly if Specs are of little interest.

Cheers, and hopefully that helps or makes some sense. (Please click to expand below. Stocks either get a NAH or a possible further research if showing signs of potential):photogenic:


i normally look at spikes in volume as a potential exit ( or reduce ) opportunity if i hold that share
 
i normally look at spikes in volume as a potential exit ( or reduce ) opportunity if i hold that share
Yeah I agree D-4, High Range High Volume "bars" are definitely a time to get nimble for a possible change of direction. Ultra high Volume even more so, whether at tops, or bottoms.

Re Spec Stocks and the concept of this Thread, apart from the Top Stocks idea, my motivation was about looking for "Bottoms" that suddenly become influenced by "unorthodox" Volume.

I'm the first to agree, as @Captain_Chaza points out, that the vast majority of any of the "Volume Stock" data presented in the last dozens of posts, is of little benefit to anyone.

What occasionally does present however, is a diamond in the rough, where that "unusual" Volume gives a heads up to something about to happen, hopefully not too far down the track.

It is a very inexact science, but hopefully the Thread/info prompts some form of questioning from punters who perhaps have never thought about how Volume/price action interacts.

Certainly not trying to preach to the converted so to speak:) Cheers M8, appreciate the input.
 
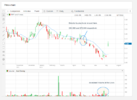
In response to @Dona Ferentes noting the 50% increase in RMY yesterday, a look at the Chart/announcements showed a couple of possible flags.

The gaps off the lows on 28th and 30th June were potential "punter" indicators for Spec hunters, given the recent Director buying, but definitely a high risk trade given the chart direction prior.

RMY did not show up in any of the regular smallcap Volume scans in prior days, but would have shown up in a (private) scan on percentage Volume increase on the 30th June (2 days before the gap up yesterday)

I thought about including Director Buying in this thread as well, but more often than not, it leads to nothing in the short term. Sometimes it can be a pre-cursor for a move a month or so down the track however. In this case the Director purchased $162,000 of Stock at almost double to price of the recent Lows.

With all that said, the Chart of RMY is below, plus I will post the recent Director Buying in the small caps just for reference.

1657670555787.png
 
Director Trades are generally red herrings, and often lead to further price drops, but occasionally there might be some Volume worth noting.

Last 3 weeks of data only:

1657670639002.png
1657670666702.png
1657670695592.png
1657670741717.png
1657670789785.png

1657671083175.png
 

Attachments

  • 1657670825081.png
    1657670825081.png
    364.8 KB · Views: 2
So close to the "Close" but of no use to me for Daily comparisons and more importantly for Weekly comparisons
I am very sad

@Captain_Chaza - @barney does this on a volunteer basis for the benefit of those who visit ASF. If you do not get anything out of it, then fine, but to complain about something someone does selflessly for free is very poor form in my opinion.
 
So close to the "Close" but of no use to me for Daily comparisons and more importantly for Weekly comparisons
I am very sad
I understand your point Captain. I still think updating the list during the day, then doing a Close of Trade would be even better, but unfortunately I still work X amount during the day and my access to a computer can be a bit random (self employed)

In my previous eye balling of the Lists, I found that both the "Volume" and "Top Stocks" tended to remain very similar after the morning trading, unless there was a Price Sensitive Announcement on another un-listed Stock.

For that reason, I pretty sure you will find the majority of the Stocks listed anytime from mid afternoon and the Close will be almost identical to the Lists that present after the Close.

I currently don't day trade Specs (accumulate 85% of the time if I buy), but by posting before the Close, those interested in taking a position based on what they see in the Lists, still have the option to do so, but a List posted after the Close does not give them that option so to speak. In reality, I doubt anyone is using my Lists for their day trading exploits, but it was a consideration I thought about nonetheless:happy:

In saying all that, I do appreciate your point given how you can see how using the data as perhaps an ongoing/weekly etc reference, and with that in mind, will try and do a Post-Close List for each day if and when I can. I will also try and remember to do an end of week update ( I am a little forgetful sometimes though, so a pre apology if I miss/forget, lol)

So from now on I will (time and computer availability permitting);

Hopefully post a "Volume" and "Top Stocks" update at some point during trading hours, and/or ...

Then post a "Top Stocks" List after the CLOSE as an end of day reference (That will have to be over 20 minutes post Close as the data is 20 minutes delayed)

Cheers.
 
Top