Australian (ASX) Stock Market Forum

The future of energy generation and storage

Sounds like a World first @Smurf1976 might be able to expand on the article.

When I looked at the headline, thats pretty impressive.
However, when you actually read the article, its not quite what it seems.
His analysis shows that for the six days identified, the state produced on average 101 per cent of the energy it needed from wind, rooftop solar and solar farms, with just a fraction of the energy the state used being drawn from gas, in order to keep the grid stable.

At times during the period, slightly less renewable energy was available and at other times renewable capacity was higher than needed, he says.
So, its actually an average, and when one looks at the breakdown, one can see the problem.
During the unprecedented 156-hour renewable run, the share of wind in total energy supplied averaged 64.4 per cent, while rooftop solar averaged 29.5 per cent and utility-scale solar averaged 6.2 per cent, clean energy website RenewEconomy.com.au reported, using Mr Eldridge’s data.
One can probably assume that wind supplied 64.4% during day or night, but you are not going to get much out of either type of solar during the night, so what supplied that extra 30% every night.
I suspect that there was massive oversupply during the day, and under supply during the night, which of course averages out at 100%.
Neat, but as the fact checkers often say, doesn't supply the full picture.
Mick
 
When I looked at the headline, thats pretty impressive.
However, when you actually read the article, its not quite what it seems.

So, its actually an average, and when one looks at the breakdown, one can see the problem.

One can probably assume that wind supplied 64.4% during day or night, but you are not going to get much out of either type of solar during the night, so what supplied that extra 30% every night.
I suspect that there was massive oversupply during the day, and under supply during the night, which of course averages out at 100%.
Neat, but as the fact checkers often say, doesn't supply the full picture.
Mick
That's why I said @Smurf will be able to give a more accurate explanation of the event. ?
It still goes back to the basic equation for renewables to work they need enough generation to supply the load and charge the storage. Plus enough storage to supply the load until you have enough generation to repeat the cycle.
A rule of thumb I read was, to replace at call generation with a renewable system, you need twice the generation capacity and three times the generation capacity in storage.
 
Have a look at the price of gas and coal.

Gas is at several times the "normal" price, to the point that it's now completely uneconomic as a power generation fuel, and coal's also at all time highs.

Between them that's a huge part of what's putting upward pressure on costs.

Plus there's the problem of the inherently inefficient structure of the industry brought about by the various politically inspired "reforms" which saw a loss of scale of economy and the emergence of countless middlemen and bureaucracies whom now account for a substantial portion of total costs to the average consumer. That's a political decision independent of the generation technology.
Most of it comes from Russia so they have the monopoly so Putin jacks the price up.
Several previous suppliers have been cut off or discontinued and the leftist idiots running Europe have invested endless billions in wind and solar!

how’s all that going?
 
Most of it comes from Russia so they have the monopoly so Putin jacks the price up.
Several previous suppliers have been cut off or discontinued and the leftist idiots running Europe have invested endless billions in wind and solar!

how’s all that going?
Russia and the OPEC countries between them control more than 70% of world gas reserves, something that's been widely understood since at least the 1970's.

The mistake is to be so reliant on the stuff in the first place since it was always heading for a problem, the only question being when and with what trigger.

Sadly this was all understood extremely well 40 years ago with most countries having plans to shift away from oil and gas due to that risk. Sadly forgotten and now the price is being paid.

Renewable energy can certainly work though and it can beat gas on price at present levels easily in countries exposed to international LNG prices. The key as with anything is building it so that it actually works and that means storage and plenty of it.

Trouble is that bit about storage. Europe hasn't built it with renewables, they thought they'd use gas for that, and they didn't fill the gas storage full this past year either.

"Just in time" is a financial concept intended to maximise profit, it's not an engineering concept to make something reliable and when it comes to economic or political theories versus physics, physics wins every time.

Trouble is, Europe's not the only place where that thinking's around..... :2twocents
 
Last edited:
That's why I said @Smurf will be able to give a more accurate explanation of the event. ?
Some data for the days leading up to 29 December 2021 as referenced in the article:

All figures refer to SA only except the "import" and "export" figures which mean flow between SA and Victoria (in industry terminology that's importing and exporting despite being within the same country). That both import and export often occur on the same day is simply because the figures are counting each in real time - for example export at midday and import at 6pm don't cancel each other out, they're added up separately.

Battery discharging = energy from the battery into the grid.

Battery charging = energy from the grid into the battery.

All figures are in GWh (Gigawatt hours. 1 GWh = 1000 MWh = 1,000,000 kWh).

Figures won't quite add due to rounding.

Wednesday 22 December:
Consumption = 38 GWh
Solar = 14.7 GWh
Wind = 12.1 GWh
Battery discharging = 0.2 GWh
Gas = 7.4 GWh
Diesel = 0.0006 GWh
Import (from Victoria to SA) = 4.3 GWh
Export (from SA to Victoria) = 0.5 GWh
Battery charging = 0.3 GWh

Thursday 23 December:
Consumption = 37
Solar = 14.2
Wind = 14.2
Battery discharging = 0.2
Gas = 5.6
Diesel = zero
Import from Victoria = 3.7
Export to Victoria = 0.4
Battery charging 0.3

Friday 24 December
Consumption = 37
Solar = 14.2
Wind = 18.1
Battery discharging = 0.2
Gas = 4.1
Diesel = zero
Import from Victoria = 2.7
Export to Victoria = 1.9
Battery charging = 0.3

Saturday 25 December
Consumption = 32
Solar = 11.7
Wind = 19.4
Battery discharging = 0.1
Gas = 2.2
Diesel = zero
Import from Victoria = 2.5
Export to Victoria = 4.1
Battery charging = 0.2

Sunday 26 December
Consumption = 31
Solar = 10.4
Wind = 25.6
Battery discharging = 0.2
Gas = 2.0
Diesel = zero
Import from Victoria = 0.2
Export to Victoria = 7.6
Battery charging = 0.2

Monday 27 December
Consumption = 32
Solar = 11.7
Wind = 26.8
Battery discharging = 0.1
Gas = 2.0
Diesel = zero
Import from Victoria = 0.01
Export to Victoria = 8.2
Battery charging = 0.2

Tuesday 28 December
Consumption = 33
Solar = 13.3
Wind = 22.4
Battery discharging = 0.2
Gas = 2.0
Diesel = zero
Import from Victoria = 1.5
Export to Victoria = 6.0
Battery charging = 0.2

Wednesday 29 December
Consumption = 40
Solar = 12.5
Wind = 19.7
Battery discharging = 0.2
Gas = 5.3
Diesel = 0.01
Import from Victoria = 3.6
Export to Victoria = 1.4
Battery charging = 0.3

Thursday 30 December
Consumption = 46
Solar = 13.4
Wind = 10.0
Battery discharging = 0.2
Gas = 15.3
Diesel = 0.7
Import from Victoria = 7.2
Export to Victoria = 0.5
Battery charging = 0.3

Friday 31 December
Consumption = 50
Solar = 13.5
Wind = 12.3
Battery discharging = 0.3
Gas = 16.1
Diesel = 0.5
Import from Victoria = 7.6
Export to Victoria = 0.04
Battery charging = 0.3

So looing at the days prior to 29 December, there were certainly periods when wind + solar output exceeded consumption in SA and there were entire days where, in total, that was the case. It would not be true to say that the state was 100% powered by renewables however first since gas-fired generation never goes to zero for technical reasons and second second because there were indeed periods when wind + solar fell significantly short of consumption hence the imports from Victoria or higher use of gas.

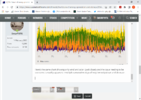
As a pattern that's not particularly unusual. This chart from the past 7 days to now, that is the 7 days to 5:30pm 17 January (SA time), shows something very similar:

1642403078674.png


Yellow = solar.
Green = wind
Blue = battery discharge
Orange = gas
Red = diesel
Purple = import from Victoria
below the zero line = export to Victoria and battery charging

Red line on separate chart at bottom = market price

Different period but essentially the same basic pattern. There are times when wind + solar does exceed consumption but others when there's a very high reliance on gas.

Here's a full 12 months worth on a daily total basis, same colour scheme:
1642404086778.png


Here's the same chart showing only wind and solar. Look closely and the issue needing to be overcome is readily apparent - multiple consecutive days of low output and some days of extremely low output can and do occur. To overcome that needs a lot more than a couple of hours storage and that's the difficult bit.

1642404208560.png


:2twocents
 

Attachments

  • 1642404185152.png
    1642404185152.png
    150.8 KB · Views: 7
Last edited:
Rubbish! Only the loons besting the drum for the renewables keen dribbling that crap!

Everyone’s power bills are sky rocketing! Not only here across the US and Europe!
Including several black outs! Thx to the useless renewables and still not being able to keep up

irony is they aren’t even green and are toxic for the environment

Electricity prices are the cheapest they have been for a decade (according to the ABC).

And if yo want to argue with that, provide some evidence.

 
Energy storage solutions is what will make renewables the no.1 source of electricity generation.

"While Australia often receives poor international press regarding its climate policies, the nation’s rapid uptake of renewables is also receiving international attention.

A recent episode of the podcast The Energy Gang, produced in the US by global energy consultants Wood Mackenzie, focused on Australia’s success in incorporating renewables into its grid to total 24 per cent, highlighting the uptake of grid-scale batteries that both store renewable energy when it is not needed and help stabilise a system originally built to transmit power from huge providers such as coal power stations.

Fereidoon Sioshansi, a US-based energy analyst, says Australia has driven down the costs of renewables and in particular solar power, not only with so-called feed-in tariffs, which leave owners of solar systems paid well for the power they feed back to the grid, but also efficient regulation."


2022-01-19 (2).png

 
I don't know how many years ago we said in this thread, that renewables will push coal off the grid as a matter of course, it's a shame it takes the Journo's so long to cotton on. :whistling:
From the article:
Renewable energy is squeezing fossil fuels further out of Australia’s power mix, accounting for a record-high share of average electricity generation in the final three months of 2021 and threatening the viability of coal-fired power plants.
The influx of large-scale wind and solar farms coupled with an ongoing boom in the uptake of rooftop solar panels have been radically reshaping the national electricity market and slashing daytime wholesale prices to levels at which the dominant sources of power – coal and gas – struggle to compete.
I wonder when then LNP will cotton on?

Maybe one day ScoMo's replacement might wave a solar panel around in Parliament instead of a lump of coal.
 
I don't know how many years ago we said in this thread, that renewables will push coal off the grid as a matter of course, it's a shame it takes the Journo's so long to cotton on. :whistling:
From the article:
Renewable energy is squeezing fossil fuels further out of Australia’s power mix, accounting for a record-high share of average electricity generation in the final three months of 2021 and threatening the viability of coal-fired power plants.
The influx of large-scale wind and solar farms coupled with an ongoing boom in the uptake of rooftop solar panels have been radically reshaping the national electricity market and slashing daytime wholesale prices to levels at which the dominant sources of power – coal and gas – struggle to compete.

perhaps we should provide links to ASF for budding pollies so that they can appear to be intelligent when they make profound statements that, in good time, turn out to be right.

If we look back at the predictions/statements made over time, we have a really astute bunch of people who argue both sides of the fence on here.
 
I wonder when then LNP will cotton on?

Maybe one day ScoMo's replacement might wave a solar panel around in Parliament instead of a lump of coal.
I personally think the States are slower to act, than tbe Feds, Snowy 2, Tassie link, GT in NSW, tbe States talk up a storm but until recently appart from S.A have done very little.
 
I personally think the States are slower to act, than tbe Feds, Snowy 2, Tassie link, GT in NSW, tbe States talk up a storm but until recently appart from S.A have done very little.
It varies between states.

SA has done some stuff as you mention.

There's more going on in Tasmania than most would likely realise and it's the usual "shoot for the stars" approach. The mouse is certainly herding the cats up enthusiastically, whether they can pull it off is yet to be proven but if it fails then it won't be through lack of trying.

For the rest well Victoria arguably has the worst long term planning in my view, mostly because there isn't really a plan other than relying on other states, meanwhile Queensland's in the most difficulty in the short term.

A current AEMO Market Notice for Qld sums it up:

94141RESERVE NOTICE28/01/2022 02:45:25 PM

STPASA - Update of the Forecast Lack Of Reserve Level 1 (LOR1) in the QLD Region beginning on 01/02/2022​

AEMO ELECTRICITY MARKET NOTICE

The Forecast LOR1 conditions in the QLD region advised in AEMO Electricity Market Notice No. 94130 have been updated at 1400 hrs 28/01/2022 to the following:

1. From 1730 hrs to 1930 hrs 01/02/2022.
The forecast capacity reserve requirement is 878 MW.
The minimum capacity reserve available is 595 MW.

2. From 1600 hrs to 1730 hrs 02/02/2022.
The forecast capacity reserve requirement is 877 MW.
The minimum capacity reserve available is 449 MW.

3. From 1900 hrs to 1930 hrs 02/02/2022.
The forecast capacity reserve requirement is 872 MW.
The minimum capacity reserve available is 503 MW.

AEMO Operations

Bearing in mind that's with load forecasts of:

February 1 = 9346 MW
February 2 = 9941 MW

So not a lot to spare and basically no room for anything to go wrong either with supply or if the load forecast is exceeded in practice. That's not an isolated incident by the way, such notices have been extremely frequent for Qld this summer thus far.

Situation would be better if Callide C hadn't had the catastrophic failure in May 2021. Return to service is currently planned for April 2023 bearing in mind it's a substantial reconstruction, it's more than just a repair job. :2twocents
 
Last edited:
It varies between states.

SA has done some stuff as you mention.

There's more going on in Tasmania than most would likely realise and it's the usual "shoot for the stars" approach. The mouse is certainly herding the cats up enthusiastically, whether they can pull it off is yet to be proven but if it fails then it won't be through lack of trying.

For the rest well Victoria arguably has the worst long term planning in my view, mostly because there isn't really a plan other than relying on other states, meanwhile Queensland's in the most difficulty in the short term.

A current AEMO Market Notice for Qld sums it up:


Bearing in mind that's with load forecasts of:

February 1 = 9346 MW
February 2 = 9941 MW

So not a lot to spare and basically no room for anything to go wrong either with supply or if the load forecast is exceeded in practice. That's not an isolated incident by the way, such notices have been extremely frequent for Qld this summer thus far.

Situation would be better if Callide C hadn't had the catastrophic failure in May 2021. Return to service is currently planned for April 2023 bearing in mind it's a substantial reconstruction, it's more than just a repair job. :2twocents
They are all commited to zero by 2050, same old story, tell them what they want to hear kick the can down the road.

By the way I dont mention Tassie, because they are that far ahead of the pack, they are out of sight.
 
So what did we say @SirRumpole , when Kurri Kurri was announced and Labor bagged it as not required? Wait and see if they cancel it when they get in. Lol
The Libs said it will be able to run on h2, politics dont you love it, they cant lie straight in bed. Lol

 
From the article:

Key points:​

  • AEMO has asked for a 66 per cent increase in funding to manage WA's main electricity grid
  • The proposal mirrors the situation on the east coast, where costs are rising as green energy levels surge
  • Renewable energy accounted for more than a third of output in the NEM in the December quarter
The agency wants $156.2 million over three years to 2025 — a 66 per cent jump on the previous period – to operate the main electricity market in Western Australia.

In a submission to WA's economic watchdog, the AEMO said it needed the extra funds to help cope with the increasing complexity and volatility in the market as more and more renewable energy flooded onto the system.

"While the growing level of variable renewable generation is helping the [WA system] transition towards clean, low-cost generation, it can pose operational challenges," it said in its submission.

The proposal mirrors the AEMO's actions in Australia's biggest power system — the National Electricity Market (NEM) – where the organisation has faced steeply rising costs to stabilise a grid that services almost 10 million customers.

As part of its most recent snapshot of the market, the Australian Energy Regulator (AER) noted the AEMO was spending tens of millions of dollars on contingency measures to ensure the NEM did not run short of power at vulnerable times.
The AER noted that the so-called reliability and emergency reserve trader scheme had been in place for a number of years but had rarely been used until recently.

It said the scheme had now been invoked in all the biggest states, including South Australia, Victoria, New South Wales and Queensland, while its total cost between 2017 and 2020 had reached $110m.

On top of this, the regulator said the AEMO was having to intervene in the normal functioning of the market by calling on more expensive power plants that could help with the stability of the grid.
The AEMO said the growing challenges of keeping the lights on were highlighted in its latest snapshot of the market, which showed record volatility in the three months to December 31.

Minimum demand for electricity from the grid fell to new lows in SA, NSW and Victoria as cooler weather subdued demand and growing amounts of rooftop solar pushed out fossil fuel-fired generators.
 
Meanwhile in Queensland, extremely tight supply situation today and consumers are being urged to reduce consumption:
Energy Minister Mick de Brenni said power companies are working to reduce demand, with big industrial users being asked to reduce their use during the peak expected this evening and tomorrow evening.

“While we are working with major electricity users to manage demand, households can also take simple steps to help like turning off devices.....


If not for agreement having been reached with certain large industrial users to pause production, blackouts would indeed be on the agenda as the only available alternative.

Peak demand is forecast to reach 10,032 MW versus the all time record of 10,044 MW. That figure is for Queensland excluding the Mt Isa region which has it's own separate power system and is not affected.:2twocents
 
Top