Australian (ASX) Stock Market Forum

Fair point, but I did say upper-middle.

In my mind, upper-middle is anyone in the higher earning professions - engineers, doctors, lawyers, tax accountants, uni prof's, senior public servants etc that are doing well for themselves.

All the ones I know in that group from gen X onwards have at least one IP.
That is what I keep trying to show you, using Sydney as a guide to how the rest of Australia lives distorts the reality, a house in Sydney can probably be used as collateral for quite a big loan, which then has a compounding effect.
Most country towns in W.A have an average price of about $150k to $400k so it is hard to gear a large loan against that.
Your idea of 'upper middle class', in reality is wealthy, in the average 'middle class' Australians eyes.
An average house in Sydney, would probably buy a motel, in a lot of country towns.
Sure but we have data on incomes, house prices etc etc.

Nobody considers a 200k house in a country town in the middle of nowhere as middle class.

A very simple example is to look at what the real estate dev's are building & selling as "middle-income". That's about the 400-500k mark last I checked.
 
I guess it is what it is, if $3 to $4 million is middle class, that makes most tradespeople on wages, very lower class.

As for data, I posted that about 5 posts ago, your upper middle class is actually the top 10% of wealth in Australia, like I said they are wealthy.

The middle class has assets of about $1.3m.
The top 10% have average assets of about $4.5m give or take, the uber rich are included in that statistic.
So lets say the top 10% start at about $2m and top out at Gina, Twiggy, Packer etc in the $billions, where does upper middle class fit? Somewhere between rich and wishing they had more? ;)
 
Sure but we have data on incomes, house prices etc etc.

Nobody considers a 200k house in a country town in the middle of nowhere as middle class.

A very simple example is to look at what the real estate dev's are building & selling as "middle-income". That's about the 400-500k mark last I checked.
And the middle income family wage is about $120k, that makes the "middle income" house and land package, about 4 times the average wage.
But if someone wants to relocate to a country town, say a teacher, nurse, sparkie etc, they could buy a house for closer to $200k and enjoy the increase in disposable income, life is about choices and compromises.
All my siblings live in country towns (brother and two sisters), their houses a much bigger than mine and nicer, but mine is worth more due to its proximity to the city.
They enjoy their choice, I enjoy mine, life isn't a competition and when it is over we all end up equal. :2twocents
No, median wage is around 78k last I checked.

And that's for the workforce as a whole, not people in their late 20's looking to buy a place/start a family.

Some jobs exist in country towns, many do not.
 
No, median wage is around 78k last I checked.

And that's for the workforce as a whole, not people in their late 20's looking to buy a place/start a family.

Some jobs exist in country towns, many do not.

It may help if you read the article below, which was posted a few posts back.
Middle class is middle income earners, not median income earners, there are a lot more lower paid than higher paid workers e.g retail sales.

From the article:
The richest tenth of households owns almost half Australia’s private wealth followed by a “comfortable middle" of 30 per cent with 38 per cent, leaving the lowest 60 per cent - who tend to be younger – with 16 per cent of household wealth.

The average net worth of the richest ten per cent reached $4.75 million in 2017-18, underpinned by substantial property assets and a disproportionate share of stocks and business investments. That group owns 46 per cent of household wealth.


The next wealth rung – the comfortable middle – had average household net worth of just under $1.3 million. About half of that group’s wealth is tied up in their own home although investment properties (with a net value of $104,000 on average) and superannuation also make substantial contributions.

The bottom 60 per cent of Australian households had average wealth of $277,000, with owner-occupied housing and superannuation the biggest assets.

The average wealth in households with a reference person aged 65 years and over was $1.38 million - 1.5 times that of younger age groups (with an average of $904,000).

Income is more equally distributed than wealth. The best-paid 20 per cent of households had an average pre-tax income of just under $300,000 a year, the middle 20 per cent $116,000, and the bottom 20 per cent $41,000.
 
Median is by definition the point at which half are earning more and half are earning less, so, the middle.

And again, there's no breakdown by age, family status and so on. It's just households, not young households trying to buy a house/start a family.

We DO have data on how many landlords there are in this country, number of negatively geared properties and so on. Top two google results:


https://www.aph.gov.au/About_Parlia...brary/FlagPost/2018/December/Negative_gearing


Both of those are a few years old now but 2.2 million landlords (so there's obviously going to be more than 2.2 million IP's) is a LOT.

If there were 10 million houses in the country at the time: https://quickstats.censusdata.abs.gov.au/census_services/getproduct/census/2016/quickstat/036

Then 22% (as a bare minimum figure) of the existing housing stock being "investment properties" is absolutely ridiculous. Considering how many own more than one, I think it fair to say that a full quarter of the housing stock is now being used to bleed the rest of the populace dry.


Home ownership rates are dropping for a reason.
 
Alright so here's something from a piece I wrote for uni for one of my masters a few years ago:


What’s the issue?

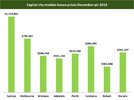
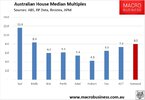
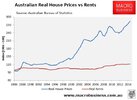
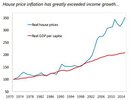
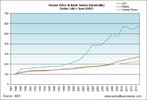
There is no metric by which Australian house prices can not be measured to be at their highest level in history:

Final dollar figure:

1.jpg

Multiples of income:

2.jpg


Multiples of rent:

3.jpg

Multiples of GDP per person:

4.jpg


Or versus the inflation rate (Consumer price index):


5.jpg


What’s the consequence?

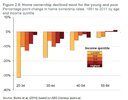
Home ownership rates have declined for the first time in nearly two generations, especially so for the young and the poor:

6.jpg


Government response(s):

The current Liberal government has established the National Housing Finance and Investment Corporation. How it came into being and what its purpose and plans are as follows:

On 7 January 2016, the Australian Government announced the establishment of an Affordable Housing Working Group (‘the Working Group’) following a request from Treasurers at the CFFR meeting in October 2015 for further work on housing affordability.

The Working Group focused primarily on investigating ways to boost the supply of affordable rental housing through innovative financing models…

The Working Group’s report, Innovative Financing Models to Improve the Supply of Affordable Housing, recommended the establishment of a bond aggregator taskforce to design a proof of concept for a bond aggregator model to provide for greater private and institutional investment in affordable housing…

In the 2017-18 Budget, the Australian Government announced the establishment of the NHFIC to operate a bond aggregator and the NHIF… The $1 billion NHIF will help to finance critical infrastructure to increase the stock of housing, particularly affordable housing, and to bring forward the supply of such housing.


(NHFIC Explanatory Memorandum).

In plain English: The government has set up a corporation with the purpose of building “affordable housing” and seeks to raise a billion dollars in funding from investors with which to do it.


Critique of the government response:

Whilst a billion dollars may sound like a lot of money (and it is), it is a drop in the ocean compared to the total value of Australia’s housing stock. A billion dollars would buy less than 900 houses at Sydney’s median house price.

The key problem with the government’s policy is that it “Focused primarily on investigating ways to boost the supply of affordable rental housing through innovative financing models”.

There are two premises in that statement: Firstly that the problem is a supply-side one, and secondly that it is caused through the inability of affordable housing suppliers to raise the necessary funds to increase said supply.

The reality is that this is completely false. Real estate remains one of the lowest-risk of any investments and private housing investors can, even now, borrow at a 95% leverage ratio (19x savings) to invest in housing from any number of private lenders (RAMS financial). A real estate investment is literally the easiest class of investment to finance – NO other investment class allows such high leverage ratios. None.

Moreover, the governmental response is one which only focuses on attempting to deal with the symptom and does not lend a single syllable to the actual cause of this problem.


Analysis of the issue:


A cursory glance at the graphs shown at the start of this submission will show a divergence point of the data by all metrics in approximately 1999, a levelling out in 2004, and then a return to that path of divergence from that point onwards.

The question therefore becomes: Why did this happen? Why did the data diverge so much in 1999 and then again when it looked like levelling out in 2004?

The answer is actually threefold:

Firstly, in 1999 the then Prime Minister John Howard halved the tax rate on capital gains of asset sales from 30% to 15%. What this effectively did was increase the yield on a capital gain, and the prices of assets such as housing were bid up to such a level as to return it to its previous level.

Every government since Howard has retained this discount.

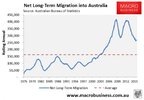
Secondly, 2004 saw Howard increase immigration levels to record levels:

7.jpg

And as you can see, every government since Howard has continued to run enormous immigration levels, at some points at up to three times previous record levels.

This isn’t a problem if infrastructure is built in congruence with the population increase, but it hasn’t been.

Chief Economist of The Australia Institute, Richard Denniss, explains what has happened as follows:

“Since the Sydney Olympics, Australia’s population has grown by the population of Sydney. Australia is one of the fastest growing countries in the developed world and our infrastructure isn’t keeping up. It isn’t keeping up now and hasn’t kept up for the last 10 years, and it’s not budgeted to keep up in the next 10. What politicians are doing is every year they announce record spending on this and a new that, but what they don’t point out is that on a per person basis, per person we are spending less on health, per person we’ve got less access to transport, per person the reason the queues in the hospital keeps getting longer is because we are not building hospitals as fast as we are growing our population. They all know it, they just don’t say it”. (Dennis, 2015).

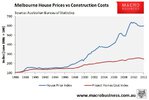
What this does is place land that is close to existing services at an absolute premium, and the data bears it out:

8.jpg

As you can see, it is not a lack of trade qualified labour driving up house price construction, it is the cost of the land that has tripled in the past 20 years that is actually the chief contributor to the increase in housing costs.

This lack of infrastructure spending cannot be blamed on state governments either:

“Because of the vertical fiscal imbalances embedded in Australia’s federal system, the Commonwealth collects 82% of total tax revenue versus the state’s and territories’ 15%, and local government’s 3%. This has left the states critically starved of funds to cope with the population influx foisted upon them by the federal government, which controls immigration policy”. (Van Onselen, 2018).


Finally, there is actually some truth to the notion that the Australian government needs to build more social housing.

The thing is that the proposed billion dollars to be spent on building it via the NHIF that this submission is for is woefully inadequate.

Saul Eslake’s submission to the senate in 2013 explains why:

Between 1947 and 1961, the housing stock increased by 50% -compared with a 41% increase in Australia’s population over this period. The Commonwealth and State Governments directly contributed 221,700, or 24% of the total increase in the housing stock over this period…

During this period, the home ownership rate increased from 53.4% to 70.3% -the largest increase in home ownership in Australia’s history.

Between 1961 and 1976, the housing stock increased by a further 46% -again outstripping the 33% increase in Australia’s population over this period. During this period, the Commonwealth and State Governments directly added a further 299,000 dwellings to the housing stock, equivalent to 23% of the increase in the total housing stock over this period.

During this period, the home ownership rate fluctuated between 68% and 71%, but remained at a high level by international standards.

Even between 1976 and 1991, the housing stock increased at a much faster rate – 41% than the population – 23% -although only 9% of dwelling completions during this period were by the public sector.

But the relationship between growth in the housing stock and population growth began to change after the early 1990s. Between 1991 and 2001, Australia’s population grew by 11.5% , while the housing stock grew by only 18.3% -less than 9 pc points more than the population. And between 2001 and 2011, while the population grew by 15.9%, the housing stock grew by only 15.2%. That is, over the past decade, the housing stock has grown at a slower rate than the population – for the first time since the end of World War II.
(Eslake, 2013).

What this shows us is that it took governments providing approximately ¼ of the housing stock in a given period in order to actually increase home ownership rates.

Australia currently builds approximately 200,000 houses per year (HIA, 2015). This means that the government would need to build approximately 70,000 homes per year (7/27=0.259) in order to contribute ¼ of the supply.

70,000 x sydney’s median house price is nearly 90 billion dollars.


This is approximately two and a half times the entire national defence budget.


What about negative gearing?


Negative gearing is the act of running an investment at a net loss (in this case, rental income after loan repayments, rates, so on and so forth) and claiming this loss back against your taxable income.

Negative gearing is not actually a principal contributor to the increase in housing affordability of the past two decades – the ability to claim rental losses back against taxable income has been possible since the 1980’s. This is a very widespread misconception.


Proposed solutions:

In order to understand what a possible solution could be, we must first understand what is NOT a solution.

As demonstrated in the previous section, a return to the social housing policies of decades past would require an almost 90 billion dollar outlay.

Every year.


Infrastructure investment is also not feasible for the same reason – Australia’s population is currently increasing by almost 2% year on year (400,000 people) between births + immigration levels (ABS).

This would require the building of a new city the size of Canberra every year.


Despite the fact that negative gearing is not a principal contributor, its abolition would actually improve housing affordability and the government’s bottom line.

Proponents of negative gearing such as Treasurer Scott Morrison state that the majority of people who take advantage of negative gearing are “normal” people “like police and nurses” (Morrison, 2018).

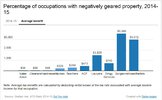
This is true, the majority of people who “negatively gear” earn less than $80,000 per year.

However the majority of the BENEFIT of negative gearing has been shown by John Daley, now head of the Grattan Institute, to go to the uppermost echelons of the income hierarchy and this looks as follows:

9.jpg


However negative gearing was calculated by May et al to “only” cost the budget approximately 3 billion dollars last financial year (May, 2017).

Research commissioned by the Australian Labor Party shows that the abolition of negative gearing combined with the abolition of the capital gains tax discount would net the federal budget approximately 10 billion dollars per year (ALP.org.au, 2018).

There is obviously no way to know for sure exactly what house prices would return to should these two policies be adopted, but should house prices return to their (likely) pre-2000 trajectory levels then this would result in an approximate halving of current house prices.


The most obvious solution to reduce pressure on Australia’s housing stock is to simply reduce the enormous increase in demand for it. Van Onselen has completed significant work demonstrating the enormous pressure Australia’s three-times-previous records immigration intake is placing on the existing housing stock (2015, 2017, 2018, 2018, 2018, 2018) and has even made personal submissions to senate inquiries on this matter, and other voices such as Dick Smith are now self-funding large scale campaigns in order to attempt to raise awareness of this fact.

However, with neither party having a policy to even so much as reduce immigration, let alone reduce it to zero and allow the country a “breather” and infrastructure spending etc to catch up, the political likelihood of this happening is virtually non-existent, despite how depressingly easy it would be to do.


The principal obstacle to improving Australian house price affordability is the sheer scale of the problem. To build the necessary infrastructure and social housing stock that improved home ownership rates in the manner in which they did in the past would literally be a several trillion dollar investment.

Governmental programs and policies promising a billion dollars in social housing funds, or abolishing negative gearing (to raise three billion dollars) therefore become drops in the metaphorical ocean when we start talking about a problem of this magnitude.

This is a problem that is simply too big to be solved with a supply-side solution, not least of all because it is not being caused by a supply side problem. It is an artificially created demand side problem, namely, immigration.


If you think enriching property owners at the expense of everyone else is not the very purpose of Australia's immigration policy, you're an idiot.


Like John Howard infamously said:

"Nobody's ever complained to me about their house price going up".
 
Alright so here's something from a piece I wrote for uni for one of my masters a few years ago:


What’s the issue?

There is no metric by which Australian house prices can not be measured to be at their highest level in history:

Final dollar figure:

View attachment 127348

Multiples of income:

View attachment 127349


Multiples of rent:

View attachment 127350

Multiples of GDP per person:

View attachment 127351


Or versus the inflation rate (Consumer price index):


View attachment 127352


What’s the consequence?

Home ownership rates have declined for the first time in nearly two generations, especially so for the young and the poor:

View attachment 127353


Government response(s):

The current Liberal government has established the National Housing Finance and Investment Corporation. How it came into being and what its purpose and plans are as follows:

On 7 January 2016, the Australian Government announced the establishment of an Affordable Housing Working Group (‘the Working Group’) following a request from Treasurers at the CFFR meeting in October 2015 for further work on housing affordability.

The Working Group focused primarily on investigating ways to boost the supply of affordable rental housing through innovative financing models…

The Working Group’s report, Innovative Financing Models to Improve the Supply of Affordable Housing, recommended the establishment of a bond aggregator taskforce to design a proof of concept for a bond aggregator model to provide for greater private and institutional investment in affordable housing…

In the 2017-18 Budget, the Australian Government announced the establishment of the NHFIC to operate a bond aggregator and the NHIF… The $1 billion NHIF will help to finance critical infrastructure to increase the stock of housing, particularly affordable housing, and to bring forward the supply of such housing.


(NHFIC Explanatory Memorandum).

In plain English: The government has set up a corporation with the purpose of building “affordable housing” and seeks to raise a billion dollars in funding from investors with which to do it.


Critique of the government response:

Whilst a billion dollars may sound like a lot of money (and it is), it is a drop in the ocean compared to the total value of Australia’s housing stock. A billion dollars would buy less than 900 houses at Sydney’s median house price.

The key problem with the government’s policy is that it “Focused primarily on investigating ways to boost the supply of affordable rental housing through innovative financing models”.

There are two premises in that statement: Firstly that the problem is a supply-side one, and secondly that it is caused through the inability of affordable housing suppliers to raise the necessary funds to increase said supply.

The reality is that this is completely false. Real estate remains one of the lowest-risk of any investments and private housing investors can, even now, borrow at a 95% leverage ratio (19x savings) to invest in housing from any number of private lenders (RAMS financial). A real estate investment is literally the easiest class of investment to finance – NO other investment class allows such high leverage ratios. None.

Moreover, the governmental response is one which only focuses on attempting to deal with the symptom and does not lend a single syllable to the actual cause of this problem.


Analysis of the issue:


A cursory glance at the graphs shown at the start of this submission will show a divergence point of the data by all metrics in approximately 1999, a levelling out in 2004, and then a return to that path of divergence from that point onwards.

The question therefore becomes: Why did this happen? Why did the data diverge so much in 1999 and then again when it looked like levelling out in 2004?

The answer is actually threefold:

Firstly, in 1999 the then Prime Minister John Howard halved the tax rate on capital gains of asset sales from 30% to 15%. What this effectively did was increase the yield on a capital gain, and the prices of assets such as housing were bid up to such a level as to return it to its previous level.

Every government since Howard has retained this discount.

Secondly, 2004 saw Howard increase immigration levels to record levels:

View attachment 127354

And as you can see, every government since Howard has continued to run enormous immigration levels, at some points at up to three times previous record levels.

This isn’t a problem if infrastructure is built in congruence with the population increase, but it hasn’t been.

Chief Economist of The Australia Institute, Richard Denniss, explains what has happened as follows:

“Since the Sydney Olympics, Australia’s population has grown by the population of Sydney. Australia is one of the fastest growing countries in the developed world and our infrastructure isn’t keeping up. It isn’t keeping up now and hasn’t kept up for the last 10 years, and it’s not budgeted to keep up in the next 10. What politicians are doing is every year they announce record spending on this and a new that, but what they don’t point out is that on a per person basis, per person we are spending less on health, per person we’ve got less access to transport, per person the reason the queues in the hospital keeps getting longer is because we are not building hospitals as fast as we are growing our population. They all know it, they just don’t say it”. (Dennis, 2015).

What this does is place land that is close to existing services at an absolute premium, and the data bears it out:

View attachment 127355

As you can see, it is not a lack of trade qualified labour driving up house price construction, it is the cost of the land that has tripled in the past 20 years that is actually the chief contributor to the increase in housing costs.

This lack of infrastructure spending cannot be blamed on state governments either:

“Because of the vertical fiscal imbalances embedded in Australia’s federal system, the Commonwealth collects 82% of total tax revenue versus the state’s and territories’ 15%, and local government’s 3%. This has left the states critically starved of funds to cope with the population influx foisted upon them by the federal government, which controls immigration policy”. (Van Onselen, 2018).


Finally, there is actually some truth to the notion that the Australian government needs to build more social housing.

The thing is that the proposed billion dollars to be spent on building it via the NHIF that this submission is for is woefully inadequate.

Saul Eslake’s submission to the senate in 2013 explains why:

Between 1947 and 1961, the housing stock increased by 50% -compared with a 41% increase in Australia’s population over this period. The Commonwealth and State Governments directly contributed 221,700, or 24% of the total increase in the housing stock over this period…

During this period, the home ownership rate increased from 53.4% to 70.3% -the largest increase in home ownership in Australia’s history.

Between 1961 and 1976, the housing stock increased by a further 46% -again outstripping the 33% increase in Australia’s population over this period. During this period, the Commonwealth and State Governments directly added a further 299,000 dwellings to the housing stock, equivalent to 23% of the increase in the total housing stock over this period.

During this period, the home ownership rate fluctuated between 68% and 71%, but remained at a high level by international standards.

Even between 1976 and 1991, the housing stock increased at a much faster rate – 41% than the population – 23% -although only 9% of dwelling completions during this period were by the public sector.

But the relationship between growth in the housing stock and population growth began to change after the early 1990s. Between 1991 and 2001, Australia’s population grew by 11.5% , while the housing stock grew by only 18.3% -less than 9 pc points more than the population. And between 2001 and 2011, while the population grew by 15.9%, the housing stock grew by only 15.2%. That is, over the past decade, the housing stock has grown at a slower rate than the population – for the first time since the end of World War II.
(Eslake, 2013).

What this shows us is that it took governments providing approximately ¼ of the housing stock in a given period in order to actually increase home ownership rates.

Australia currently builds approximately 200,000 houses per year (HIA, 2015). This means that the government would need to build approximately 70,000 homes per year (7/27=0.259) in order to contribute ¼ of the supply.

70,000 x sydney’s median house price is nearly 90 billion dollars.


This is approximately two and a half times the entire national defence budget.


What about negative gearing?


Negative gearing is the act of running an investment at a net loss (in this case, rental income after loan repayments, rates, so on and so forth) and claiming this loss back against your taxable income.

Negative gearing is not actually a principal contributor to the increase in housing affordability of the past two decades – the ability to claim rental losses back against taxable income has been possible since the 1980’s. This is a very widespread misconception.


Proposed solutions:

In order to understand what a possible solution could be, we must first understand what is NOT a solution.

As demonstrated in the previous section, a return to the social housing policies of decades past would require an almost 90 billion dollar outlay.

Every year.


Infrastructure investment is also not feasible for the same reason – Australia’s population is currently increasing by almost 2% year on year (400,000 people) between births + immigration levels (ABS).

This would require the building of a new city the size of Canberra every year.


Despite the fact that negative gearing is not a principal contributor, its abolition would actually improve housing affordability and the government’s bottom line.

Proponents of negative gearing such as Treasurer Scott Morrison state that the majority of people who take advantage of negative gearing are “normal” people “like police and nurses” (Morrison, 2018).

This is true, the majority of people who “negatively gear” earn less than $80,000 per year.

However the majority of the BENEFIT of negative gearing has been shown by John Daley, now head of the Grattan Institute, to go to the uppermost echelons of the income hierarchy and this looks as follows:

View attachment 127356


However negative gearing was calculated by May et al to “only” cost the budget approximately 3 billion dollars last financial year (May, 2017).

Research commissioned by the Australian Labor Party shows that the abolition of negative gearing combined with the abolition of the capital gains tax discount would net the federal budget approximately 10 billion dollars per year (ALP.org.au, 2018).

There is obviously no way to know for sure exactly what house prices would return to should these two policies be adopted, but should house prices return to their (likely) pre-2000 trajectory levels then this would result in an approximate halving of current house prices.


The most obvious solution to reduce pressure on Australia’s housing stock is to simply reduce the enormous increase in demand for it. Van Onselen has completed significant work demonstrating the enormous pressure Australia’s three-times-previous records immigration intake is placing on the existing housing stock (2015, 2017, 2018, 2018, 2018, 2018) and has even made personal submissions to senate inquiries on this matter, and other voices such as Dick Smith are now self-funding large scale campaigns in order to attempt to raise awareness of this fact.

However, with neither party having a policy to even so much as reduce immigration, let alone reduce it to zero and allow the country a “breather” and infrastructure spending etc to catch up, the political likelihood of this happening is virtually non-existent, despite how depressingly easy it would be to do.


The principal obstacle to improving Australian house price affordability is the sheer scale of the problem. To build the necessary infrastructure and social housing stock that improved home ownership rates in the manner in which they did in the past would literally be a several trillion dollar investment.

Governmental programs and policies promising a billion dollars in social housing funds, or abolishing negative gearing (to raise three billion dollars) therefore become drops in the metaphorical ocean when we start talking about a problem of this magnitude.

This is a problem that is simply too big to be solved with a supply-side solution, not least of all because it is not being caused by a supply side problem. It is an artificially created demand side problem, namely, immigration.


If you think enriching property owners at the expense of everyone else is not the very purpose of Australia's immigration policy, you're an idiot.


Like John Howard infamously said:

"Nobody's ever complained to me about their house price going up".

I would vote 4 u if that was part of your campaign... maybe make Australia great again or something along those lines
 
To be honest, the hard part is convincing the leftards that they're getting played. In their minds, they're too smart for anyone to get the better of.

I mean most people would have some kind of cause for pause if 80% of their political positions were shared by goldman sachs, but not these people. The lack of self awareness is stupefying.
 
So far as governments and social housing is concerned, I've no idea what the other states did but decades ago Tasmania had what was effectively a government-owned building company.

So they employed tradesmen and so on and the purpose was to build public housing. With the workers employed directly, all the houses built to the same design at any given time and all materials bought in bulk the cost was kept down. It was a very production line sort of approach which brings efficiencies.

The houses were built solidly, they haven't fallen down or anything like that, and it all seemed to work at the time financially.

A different era back then though.
W.A was exactly the same in the 60's and 70's, most people lived in a state housing commission home, then they started selling them off.
Now we have a mess, as usual, when a perfectly well run Government essential service is farmed out just so that a politician can't be blamed for having a crap portfolio.
Now the go to answer is, that is a contract service, contact the private operator, we only supply the bond and rental assistance, not my problem. ?
 
So far as governments and social housing is concerned, I've no idea what the other states did but decades ago Tasmania had what was effectively a government-owned building company.

So they employed tradesmen and so on and the purpose was to build public housing. With the workers employed directly, all the houses built to the same design at any given time and all materials bought in bulk the cost was kept down. It was a very production line sort of approach which brings efficiencies.

The houses were built solidly, they haven't fallen down or anything like that, and it all seemed to work at the time financially.

A different era back then though.
Thatcherism (private enterprise) have stolen from the ordinary people. World is stuffed
 
Thatcherism (private enterprise) have stolen from the ordinary people. World is stuffed
Socialism(public services ) have stolen from the ordinary people. World is stuffed :)
There is nothing wrong with private enterprise but a lot very wrong with cronyism with is the distorsion of capitalism by a clique of power enabled (Public servants, politicians elected or not) directing preferences, markets, corruptions to [usually] conglomerates (only big fish are able to pay the direct or indirect bribes requested.)
 
You lost me there in the second paragraph ..... interpreted as, if I read correctly, ALL middle class boomers have 2 additional properties in addition to their PPR. That’s simply not true, I’m a ‘ middle class boomer’ and I don’t have 2 additional properties to my PPR. For all your contributions and good/strong discussions, your argument goes down in my eyes with that statement when I know it’s incorrect. I don’t have 2 additional properties.
I enjoy reading your contributions and they are very thought provoking, however when ‘facts’ presented are known not to be fact, unfortunately your arguments diminish in their validity, which is a pity as generally they seem reasonable.
Gunnerguy
(please play nicely children, robust and none demeaning discussions are great)
I can't see who you're responding too as he has blocked me. But, I'm pretty certain I know who it is and his constant criticisms of boomers and blaming them for his lack of whatever it is he wants is boring to say the least.
 
I can't see who you're responding too as he has blocked me. But, I'm pretty certain I know who it is and his constant criticisms of boomers and blaming them for his lack of whatever it is he wants is boring to say the least.
Funny, can not see either so must be in my blocked list.and... i am no boomer..
 
The deployment of several-syllable words that absolutely nobody ever uses is universally done only by midwits trying to make themselves sound much smarter than they actually are. Snarks are a universal tell of a combination of both snivelling conceit and repressed envy manifesting as resentment.

You're not intelligent, you're a pseudointellectual trying to masquerade as an actual intellectual, and are as mistaken as you are transparent.


Let me guess, arts degree?


Blocked.
 
Top