Australian (ASX) Stock Market Forum

Roller's Intraday futures journey

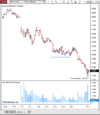
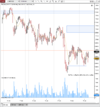
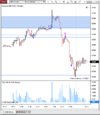
We got a nice retest of the old support /resistance and a chance to get in. Annoyed about my exit though originally I had my target where I exited but once more supply come back in I moved it down to basically where price reversed at an old support line. But once we got to my first target and there was a bit of trading action around there I got nervous and moved it up.

Some people struggle with moving stops and not being able to take losses and turning them into larger ones, this is never been my issue. I'm one of those people that likes to cut winners off early on the fear of giving it all back.

1642485453632.png
 
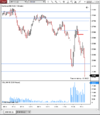
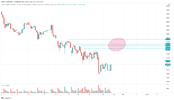
Just the one trade today so far, was a bit reluctant with the big gap above it but it worked out. Once again got nervous on that bounce and moved my stop down once we came back to my first target. My second target was the blue line just below the current price. Much easier following the trend than fighting it

Reluctant to take shorts above this area because we are sitting in a important area where we could get a bounce from imo.

1642566224855.png
 
Was tempted to put A tick chart up with 500 different support lines on it lol

i'll keep these charts 5 min lol

200.gif
 
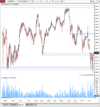
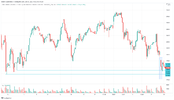
Ouch! I had this trade planned out this morning once we opened down lower, was waiting for a push up into the area between those lines but for once I was actually too patient and didn't pull the trigger soon enough. Once we broke that red line I have marked on the chart, I put my sell limit there but it never came back, got within a tick or two I think. oh well, 450 points and counting :banghead: . First target would have been the line just above 350

1642641653144.png
 
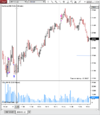
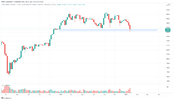
Only at the desk in the morning but had a couple of chances at the trade i wanted. Hit the Target while i was away, currently my best trade management strategy, set and forget! as you can see being too aggressive with moving the first stop!

Trade was against the Dominant mid term trend but sitting just above daily support so i thought it warranted.


1643015147982.png
 
@Roller_1, how's trading going?
Hi Mate, haven't really been doing much this week after Monday. There was a bit of stuff going on in my life that was getting in the way. Found some time to get to the charts but wasn't really focused and did some silly trades. But very quiet mostly, hopefully get back into it this week.

How Have you been going?
Been going good mate. Just working on getting prop funded. I'm about 2.5% up on my account - about 7.5% to go.

Wanna do some analysis for the Mini Nikkei Futs for direction bias for this coming week?
 
?Been going good mate. Just working on getting prop funded. I'm about 2.5% up on my account - about 7.5% to go.

Wanna do some analysis for the Mini Nikkei Futs for direction bias for this coming week?

Nice, what is the go? You have to grow your personal account by 10% to be able to get funded.Then you have a max % loss or Drawdown level?

I'll chuck some charts up soon. ?
 
Nice, what is the go? You have to grow your personal account by 10% to be able to get funded.Then you have a max % loss or Drawdown level?
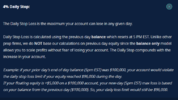
Yeah, so it's for funding on a $100k account. Currently in evaluation stage. Got to make 10% on the account. Daily and overall DD rules below:

1643506397854.png

1643506420975.png
 
Do you have to pay like a subscription to get funded? Or anything like that? Or is the risk entirely theirs.

They sound like fair enough parameters though I would think. A fairly generous daily loss amount.
 
Do you have to pay like a subscription to get funded? Or anything like that? Or is the risk entirely theirs.

They sound like fair enough parameters though I would think. A fairly generous daily loss amount.
Yeah, so it's $750 USD to take the evaluation and then once you become profitable, your account resets to $100K and you get 1 withdrawal per month on the profits you make. The firm gets 25% of what you withdraw and you get 75%. The account is in USD and you get paid in USD so the exchange rate for Australian traders is great as long as the AUDUSD remains below or equal to 1.00000.
 
1643508092153.png
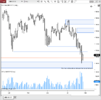
A strong downtrend over the last three or four weeks. Dipped down into some long term possible demand where we have got that bounce from the blue box. I think this will be an important area to defend, if price breaks down below this area there is a few hollow bars that might like to be filled in below. Much like most of the futures charts I would imagine.

Weekly Trend: dwn
in a Possible bounce zone?

1643508438463.png


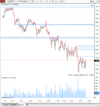
Similar on the daily, a few break of structures to the downside. There was a lot of choppy price action that was kind of muddying the waters for me in the last week so I was a bit confused about where we could go. Some areas marked above current price but that is still a fairway off.

Daily Trend: Down

1643509136759.png
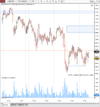
can see the choppy PA a bit better on the four hour chart. Which was taking place on the way down to long-term support, well a area where price had previously reversed (orange line). Part of the reason I was a bit confused this week sitting around a few areas I thought we might get a bounce from but nothing really eventuated until the big drop.

possible area for shorts around the blue box, although it is a bit above current levels and also if we are bouncing off that weekly zoned it might not be ideal?. This has been throwing me a bit the last week while we have been trending down into longer term support.

4hr Trend: Down - Showing signs of turning? Higher low could be in place..

1643509688009.png

Filled a little overnight gap on the Friday after hours session. And then got a nice bounce.

Trend is still down So I want to be wary of any longs but bouncing off that longer term level, we may have a stronger week than we have had. Would be good to get a push up into that blue box and then I retest of this current area.

Of course this could all be crap and we may blast through that weekly level and trend way down. A lot of negative sentiment around which points to a bounce...

Let me know your thoughts and how far off I am =]
 

Attachments

  • 1643507704954.png
    1643507704954.png
    31.5 KB · Views: 5
  • 1643509746096.png
    1643509746096.png
    54.8 KB · Views: 2
  • 1643508957310.png
    1643508957310.png
    39 KB · Views: 0
Okay - first and foremost we must understand where we are in structure - both (candlestick and institutional) on all timeframes. This might be a long post so bear with me.

Monthly - Trend up

Cam, what the hell does a monthly chart have to do with trading the 5 minute time frame you might say - everything. All analysis should work top down. We can see here that on the long term monthly chart we are in an up trend. However, intermediary structure on the monthly has shifted bearish. What do we need to look for? We need to look for the last unmitigated down move before the up move that broke structure - marked with the blue box. This would be my longer term bearish target.

GTJ6PtKq


Weekly - Trend down

We can now refine our monthly demand zone to the down move before the up move on the weekly that has not been mitigated. You can see it marked blue in the weekly chart below. Take very careful notice that the low of that last down candle liquidated the lows of the 3 prior candles. This is the composite man liquidating all the 'dumb money' that FOMO'd into buys too early before taking price significantly higher.

y1dN7wPu


Daily - Trend down

Daily in a down trend as well. Again, we can refine our demand zone which I have done.

T7FtksqP


4 hour - Trend down

We have broken structure and the trend is clearly down here, but we have been chopping sideways. Hard to have a tradeable shorter term bias using this specific timeframe. We need more data. 1 hour chart.

Ad1kN7oA


1 hour - trend down/sideways chop

This is where things start to get exciting for me. Because the edge that we have in these markets is our understanding of institutional order flow, candlestick structure and where liquidity lies in the markets. Stanley Druckenmiller once said that 'It's liquidity that moves markets', and I didn't understand this statement for the longest time. However, once I got my head around institutional order flow and where liquidity lies in the markets that the composite man needs to target - my trading just exploded.

So what I see here is a break of structure and then liquidity being created above each of those swing highs ready for the composite man to run. On this timeframe you can see the up move before the down move that has not been mitigated is highlighted in green.

vpydPge1


30 minute

The purpose of this chart is simply to show the further refinement down to the last up move that I like. I usually only like to refine my supply and demand zones to the 30 or 60 minute charts. Keep in mind that the lower the timeframe you refine down to, the lower the probability that price will trade into it. You can also see that there is an up move above the one I have marked - however the reason I don't use it is because it has been mitigated by the up wicks of the candles in the zone I am using.

zo5sjdl9


4 minute

On this 4 minute chart you can see that we broke structure to the upside which was created by the unmitigated down move shown marked in the darker shade of blue - then what happens? Price pulls back into where? The last down move that created the new structural high on this timeframe - why? To mitigate the sell orders used by the composite man to fill their buy orders and take prices significantly higher.

What am I looking for now? The same thing. A structural break to the upside, then a pull back to the last unmitigated down move that initiated the structural break to the upside - marked in the light blue box. Here I would be looking to enter with the expectation that the composite man will then eventually want to run the liquidity points that can be seen on the 30 minute chart into the next supply zone (also on the 30 minute) before we see some kind of Wyckoff distribution schematic to take price significantly lower - where exactly? Well, firstly the structural low on the 30 or 60 minute chart and then eventually to the unmitigated demand zone marked on the daily chart.

yVGDVeow
 
Last edited:
Let me know your thoughts and how far off I am =]
Really great work mate. :xyxthumbs:xyxthumbs

Just remember that if price at all comes into a zone that you have marked as supply or demand - I then consider that mitigated and I don't usually use it. I'm looking for the unmitigated zones. Look for price imbalance below the supply zone or above the demand zone.

With all the choppy PA over the last week or two I have been struggling too see areas that have not been tested or mitigated yet.

Looks like we have some similar views on what's going on so that is good to see for myself.

will be interesting to see what happens when we get up into all these areas where price has had swings. Like you said there is a lot of liquidity lying around these swing high & lows, wouldn't surprise me if we had some strong impulsive moves straight through it all. It is about a 2% range so if it gets on the move it could do it fairly easy.


1643519860126.png
Similar to what happened on the way down in this old area of choppy price action. Strong impulsive move straight through it all the lows

1643520182026.png
 
I see tradingview charts are slightly different to mine in ninjatrader especially when you go back and look at prices from older contract periods.

I'm not sure how tradingview deals with the difference between contracts when they are stitched together, I am pretty sure ninjatrader accommodates to this and adjust them. Will do some digging

1643520647893.png

1643520600260.png
 
Top