Australian (ASX) Stock Market Forum

NYSE and the status of world markets

I am trying to find a pattern with large volume spikes

Ann I noticed a strange thing when I looked at my chart after seeing your post, I noticed that I have a different volume. I tried to make my chart look like yours to see if there was any other differences. I will see if my volume changes when I download data on Tuesday morning. Here's my chart;

1651293118148.png
 
Ann I noticed a strange thing when I looked at my chart after seeing your post, I noticed that I have a different volume.

I just checked on Barchart and the volume there is 13.633M, I've got some questions for my data supplier.

I am not sure but it may be figures taken after the close. Your figures may cut off at the equivalent of 4pm and IC may cut off at the equivalent of 4.10 if you follow me.

I often see slight differences in the commodity prices as well from US charts. I think they must do a European close. Truly don't know and I am only guessing.
 
@DaveTrade just as a follow-along related to volumes it may be your volume data is taken at 4pm and my volume data may have been taken at 8pm. That four extra hours of trading would certainly explain the volume difference.

AMZN after close.png
 
it may be your volume data is taken at 4pm

Yes that may be it or there may be something related to volume at close of the market or volume at settlement. I'll ask my data supplier to clarify to issue, it's important to me because I use volume in some of my indicators. Thank for your interaction, without that I may not have seen this problem.
 

No Banks, No Bull

By Mike ReillyMay 11, 2022

Regardless of daily headlines about the current direction of equity markets, what the Fed is thinking, or what Elon is doing, there are a few tried and true rules that remain pretty consistent.

And one of those rules is that without banks, there are no bull markets.

That doesn’t mean banks have to be the life of the party, but they have to at least show up.

And the problem is – they haven’t.

At a time when banks should be basking in the glory of higher rates (and a higher bottom line) banks are acting more like growth stocks than cyclical value plays.

1652329167006.png


The SPDR Financial ETF XLF now sits at 52-week lows and its year-to-date performance is in line with the overall market – not with value stocks.

XLF has shed over 13% of its value this year, while the S&P 500 has a 16.51% drawdown.


1652329219252.png


And XLF would likely be enduring even larger drawdowns if it were not for its 15.22% stake in Berkshire Hathaway, Inc. (BRKB)

Some of XLFs biggest holdings (banks) are getting smoked in 2022.

We’re seeing real drawdowns in JP Morgan, Bank of America, Wells Fargo, Goldman Sachs, and Morgan Stanley – none of them have been immune to this year’s sell-off.


1652329267419.png


Here’s the thing… this isn’t just a story about a drawdown in Financials.

There are broader market implications when banks struggle.

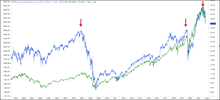
The price chart below tracks the performance of the Financial sector using XLF as its proxy and an overlay of the S&P 500 index.

I’ve outlined two historic market breakdowns below in 2008 and 2020 that proceeded or accompanied breakdowns in the S&P 500.

The question is, are Financials foreshadowing a more significant collapse in equity markets?

1652329850436.png


Where go banks, go the market…

Digging deeper into breadth in Financials we can see the percentage of stocks in the sector trading above their 50-day moving average just fell below 5% after diverging from index prices for much of the past year.


1652329970209.png


During healthy markets, the percentage of stocks in an index or sector that are trading above their long-term 200-day moving averages tends to stay above 60%.

During unhealthy markets, we usually see the opposite – fewer than 40% of stocks tend to hover above their averages.

For Financials, that’s what we’ve been seeing – the percentage of members above their 200-day average falling below 40%.

Key points:

  • Fewer than 5% of Financials are trading above their 50-day averages.
  • Fewer than 40% are holding above their 200-day averages, a worrying decline in long-term trends.
  • Similar combinations have preceded poor returns in the sector and the broader market.
This vital sector is seeing souring trends.

For anyone other than the most current generation of investors, trouble in Financial sector stocks sends a shiver down the spine.

The meltdown in 2008 leaves the kind of scar that never fully heals. It seems hard for U.S. citizens to imagine now, but there was a daily worry about whether we would even be able to withdraw our own funds from banks the next day.


1652330150088.png


Equity investors do not want to see trouble in Financials. Traders tend to sell these stocks and ask questions later because a single over-leveraged client can bring down an entire institution.

With coincident and severe declines among a broad array of stocks and bonds, there is almost assuredly a large client somewhere that has blown up or is about to.

With investors avoiding stocks in this sector to the degree that they are now, it’s a worrying sign for all of us.

Financials remain an important key to the success of the broader market.
 

Attachments

  • 1652329319602.png
    1652329319602.png
    109.9 KB · Views: 10
The July Jobs Report Is a Lie

mj-sig-box-tall.jpg

Stocks fell this morning after the Bureau of Labor Statistics (BLS) revealed a way stronger than expected July jobs report. The Dow, S&P, and Nasdaq Composite all sunk on the “good news is bad news narrative.”

“This is hot. For the Fed, this is another 75 basis point hike,” said Diane Swonk, KPMG’s chief economist.

“The Fed is dealing with strong demand in a supply-constrained economy, and that demand extends to labor,”

According to the BLS, the US added a stunning 528,000 jobs last month, beating the 250,000 job estimate with ease while hitting a monthly payroll gain unseen since February (when 714,000 jobs were added). Last month’s jobs tally was revised to 398,000 (up from 372,000) as well.

“Anybody that jumped on the ‘Fed is going to pivot next year and start cutting rates’ is going to have to get off at the next station because that’s not in the cards,” said B. Riley Financial’s Art Hogan.

“It is clearly a situation where the economy is not screeching or heading into a recession here and now.”

Unemployment slid from 3.6% to 3.5% as a result despite a puzzling reduction in the labor participation rate, which fell from 62.2% to 62.1%. Labor participation has been trending lower since March.

Wages also climbed 5.2% year-over-year, beating the +4.9% estimate. This perhaps scared bulls the most as the Fed is expected to view red-hot wages as a reason to raise rates aggressively.

And, below the headline jobs gain (as reported by the establishment survey), the household survey was somewhat underwhelming once more. Showing little gain in the number of US workers (just +179,000 in July), the discrepancy between the household and establishment surveys grew to 1.8 million, up from 1.5 million in June.

Keep in mind, too, that July’s major beat was driven by a heavy-handed seasonal adjustment – something the mainstream media seemed to miss today.

The BLS applied a seasonal adjustment of about 900,000 jobs last month. No, you read that correctly.

Unadjusted, the US economy actually lost roughly 385,000 jobs. July 2021’s unadjusted jobs number was just -41,000 jobs by comparison.

That’s probably why the household survey hasn’t tracked the headline jobs gains month after month; the BLS is going way overboard with seasonal adjustments to the upside.

Meanwhile, the number of multiple jobholders continues to climb opposite full and part-time workers. In fact, multiple jobholders whose primary and secondary jobs are both full-time positions just hit a record high in July.

And so, really, the situation isn’t at all different from June. More importantly, the jobs data coming in is persistently confounding.

That’s why investors should probably ignore it moving forward. In January, the BLS revised down March-July 2021’s jobs reports by a total of 1.061 million payrolls. Then, they revised August-December 2021’s tally higher by 817,000 jobs.

In other words, investors were virtually flying blind for the entirety of 2021. Seasonal adjustments were to blame.

Come January 2023, I bet we’ll see a similarly impressive downward revision for March-July of this year for the same reason. And, just like last January, the BLS will quietly slide the correction in under a major headline jobs beat, once again obscured by a stiff seasonal adjustment that makes US labor look far stronger than it really is.
 
interesting , i kinda hope he is wrong

but i can't see how they will dig themselves out .

i assume he means single digit returns , after inflation is factored in .

but what does HE call 'inflation ' if it is the official CPI we are heading into a very dark place
 
interesting , i kinda hope he is wrong

but i can't see how they will dig themselves out .

i assume he means single digit returns , after inflation is factored in .

but what does HE call 'inflation ' if it is the official CPI we are heading into a very dark place
He is using ppi fir the chart so that is the reference


Note above video uploaded on Friday night 12th Aug aest before US market session

Borrowing an expression that is used by another contributor of this forum, I think this guy "nailed it". I've looked at $SPX from every angle I can think of and I keep saying to myself "I just can't see it, I need another week".
 
Top