Australian (ASX) Stock Market Forum

Iron Ore

China’s top steel industry executives and senior government officials outlined a strategy for achieving the five-year targets in an article published this week, which highlights the Chinese government’s frustration with volatile iron ore prices and its desire to follow Japan’s lead by investing heavily in offshore mines.

The article published in the state-backed Economic Daily singled out Australia and Brazil for dominating China’s imports of the steel-making ingredient.
The control of overseas iron ore resources is obviously insufficient, and more than 80 per cent of the import volume comes from Australia and Brazil. The risks to resource security are prominent,” said Chen Ziqi, a senior executive at China International Engineering Consulting Corp, a major adviser to the Chinese government on investment and construction.

Mr Chen outlined a target to have mines with majority Chinese equity stakes providing more than 20 per cent of imported iron ore by 2025, compared with 8 per cent currently. The article noted that overseas mines partly owned by Japanese interests accounted for 60 per cent of that country’s imports.

Mr Chen acknowledged the high risks in his comments and noted most of the world’s high-quality iron ore resources had already been carved up by developed countries.
Only low exploration levels, poor resource conditions, large investment scales, long return periods, and backward infrastructure are left to Chinese enterprises. Risky projects,” he said.

??
 
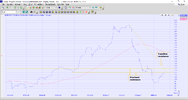
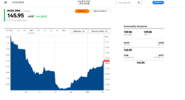
Here is my current chart for Iron Ore, I am not at all bullish on this. There appears to be an assortment of prices for Iron Ore. I am not too fussed as long as I use the same chart for consistency. Why the differences? I am not 100% sure but it may be the prices are drawn from different places as in the Singapore Metals exchange or Iron ore prices refer to Iron Ore Fine China Import 63.5 percent grade Spot Cost and Freight for the delivery at the Chinese port of Tianjin. This last price is where Trading Economics gets their price.

The higher price @Dona Ferentes is quoting may be a futures contract or a spot price somewhere. It may well be my chart is displaying the futures contract from the August contract. https://www.barchart.com/futures/quotes/C0*0/futures-prices
I am not sure. It may be the difference between the spot price and the futures price. I know IC charts can differ slightly as closing prices can be taken from different exchanges. That is why there may be discrepancies occasionally. Anyhow, not having made that any clearer for anyone, here is my chart for Iron Ore.

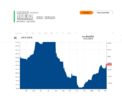
Overhead resistance lines and a falling trendline and battling well under the 200dsma.

Iron Ore 2.1.21.png
 
The higher price @Dona Ferentes is quoting may be a futures contract or a spot price somewhere. ,
Hi there, I got that number from the daily update sourced from Reuters and / or Bloomberg. Usually dropped into the Market Talk in the AFR most days.

Tried to check it's attribution but there was no link . I think it is 62Fe at Dalian spot price, which is, if not a Benchmark, a commonly quoted daily indicator

Here's the commodity numbers for Saturday morning.
  • Spot gold +0.7% to $US1826.95 an oz
  • Brent crude -2.1% to $US77.84 a barrel
  • US oil -2.3% to $US75.20 a barrel
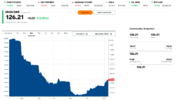
  • Iron ore +1.2% to $US120.75 a tonne

Just one of life's little mysteries I guess Dona. Perhaps I will spend a bit of time on IC and see if Colin Twiggs explains where he got his price, probably should have done that in the first place. However, as that is the only Iron Ore price he has on his charts I am stuck with that one! :)
 
China’s top steel industry executives and senior government officials outlined a strategy for achieving the five-year targets in an article published this week, which highlights the Chinese government’s frustration with volatile iron ore prices and its desire to follow Japan’s lead by investing heavily in offshore mines.


as a holder of MGX and GRR , i am wondering what the heck these execs are talking about , where the Chinese have seen good value they have been chest deep , investing in almost any mine they can get a stake in , and have been doing this for years , although i notice Ms. Rinehart preferred South Korean partners

but let's see i suspect China will invest more in developing nations with iron deposits although they will have to be quick India will soon work out they need to do the same
 
Here is my current chart for Iron Ore, I am not at all bullish on this. There appears to be an assortment of prices for Iron Ore.
the chart is based on London Metals Exchange. But even they seem to have a variety of reference prices. As long as yr chartist uses the same data source all the time, then you have a trend that means something !

"The LME publishes a set of daily reference prices that are used the world over by industrial and financial participants for referencing, hedging, physical settlement, contract negotiations, margining and portfolio evaluations.

"Based on some of the most liquid trading sessions of the day
, LME prices are good indicators of where the market is at any point in time.

"The LME Official and Settlement prices, are based on trading activity on the Ring. The Unofficial and Closing Prices are based on trading activity on LMEselect. The LME Asian Reference Price is calculated using the volume-weighted average of trades transacted on LMEselect during the most liquid period of Asian trading hours....

 
the chart is based on London Metals Exchange. But even they seem to have a variety of reference prices. As long as yr chartist uses the same data source all the time, then you have a trend that means something !
Thanks Dona, that saves me from hunting through IC. I had a feeling IC prices were based on LME but when I looked I couldn't find an Iron Ore price on LME.

As you say, using the same data source to chart keeps the consistency.
 
Iron ore still rising. At the moment the most significant news is heavy rain in Brazil closing down operations at Vale. All Oz miners have jumped 3-4%.

The situation of the tailings dams remains a concern. The history of recent collapses in these dams is not good (for Vale)

In December, Brazil had 40 tailings dams on the emergency level, 36 of which are in Minas Gerais, according to the country’s mining regulator. Three of those — all owned by Vale — are at the highest alert of level 3.

 
China and Russia are turning out to be great friends. Russia has the third biggest iron ore reserves in the world.
 
At some stage , probably around $150, China will seriously crack the xhits.
Patience. Latest commodity spots:
  • Spot gold -0.03% to $US1806.27/oz
  • Brent crude +1.8% to $US91.04 a barrel
  • US oil +2.2% to $US90.20 a barrel
  • Iron ore n/a due to Asian Lunar holidays
 
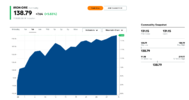
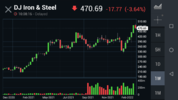
Iron ore, like oil and other commodities, rising sharply. On the backs of war and terror.:(


1646697382542.png
 
Top