Hey @tech/a ,
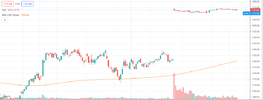
If you get a chance I was wondering if you can give a bit of a run down on the chart below? I see this happen quite a bit where there is nice range and then a volume spike with corresponding price jump occurs but the the range shrinks dramatically and goes sideways. I've seen this go on for a couple of months on some charts. Do you just give up watching it after a certain amount of time or is this to keep watching?

If you get a chance I was wondering if you can give a bit of a run down on the chart below? I see this happen quite a bit where there is nice range and then a volume spike with corresponding price jump occurs but the the range shrinks dramatically and goes sideways. I've seen this go on for a couple of months on some charts. Do you just give up watching it after a certain amount of time or is this to keep watching?

