Australian (ASX) Stock Market Forum

How to Trade or Invest Profitably - "Without The Bullsh*t" - Technical Analysis Step by Step Tutorial Plus Q&A Thread

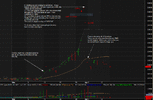
Id want proof this is still full of momentum so a stop limit order 3 Ticks above the high so
if it powers off I dont miss it.
How do you determine stop limit entry size?
or are you looking at scaling in?
or do you use fix capital amount for stop limit?
 
Last edited:
How do you determine stop limit entry size?
or are you looking at scaling in?
or do you use fix capital amount for stop limit?

In this case and all others like it. If price is coming to test a level on the up side
Its not un common to go beyond the previous high 1 or 2 ticks before coming off again.
I used to get caught a lot when placing orders 1 tick and even 2 ticks above the high.
3 ticks not so often. (Reversing badly on me) Not an exact science but one of past experience.
I'll elaborate further as more of the charts are revealed.

What would make you confident of your trailing stop buy duck? I.e if it busts price X, what would make you think it's going to continue surging past it?

This is why I've never really liked stop-loss orders, for all the times they might save you from a plummet, they're more than offset by the times they make you realise the loss/sell in a dip. Same goes for buying on an upswing but the other way around.

Confidence would depend on when the Stop order was taken out.
Pretty confident if its from a tight consolidation after I exited.
Next day with no consolidation is a difficult one as I'd be looking at 15 min charts
to determine continuance or sharp reversal. (This is where they occur very next day.)

More to come on the chart.

I will run stop loss orders up behind a really fast mover using a 15 min chart
If its up 100% its going to come off sooner than later--I wont most of the move.

Your right IF you DONT continue to monitor the Chart after you exit--perhaps
prematurely.

I've saved more from early exit on the sell of a trade than I have on the entry.
Sure I've missed some profit but in variably Id have had to watch constantly and trade
5 min charts.


Its just my experience --- yours maybe different.
 
Oh weak hands are green hands no question.

But everyone's been stung trying to catch something on the upside only to basically just buy at the peak & watch your money disappear before your very eyes.
 
Oh weak hands are green hands no question.

But everyone's been stung trying to catch something on the upside only to basically just buy at the peak & watch your money disappear before your very eyes.

If your "watching" your money disappear in front of your own eyes then your not admitting that your wrong.
As a good friend of mine often says.

"Its not about being wrong its about HOW LONG you stay WRONG."

Needless to say I'm wrong lots and lots.
I dont stay wrong long but I stay right a lot longer.
 
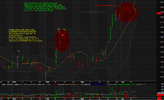
To the next 2 Bars
Both on lower volume
Both high up and above the V/C zone
where Id expect the zone to act as a support zone
I dont want to see price well into that zone.
Above the low of the bar marked (3) is fine But Id be selling if
price falls into the zone. I dont like giving away profit---its mine!

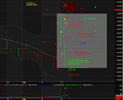
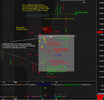
Chart reading 4.gif
 
Sorry about the length of this post But I've bought this trade up to TODAY

So from here its live.


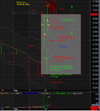
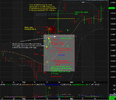
So the next two bars are in greatly diminishing volume and are closing high
toward the top of the bar who's high is being tested. You'll also note that there
is no price action down into the V/C zone which indicates that those who bought
aggressively are holding their stock. All in all Id be looking to add to my position if
trading reached .051c Stop logically would be .041c but Id be looking to get out earlier
if traded at .045c.


Bara analysis 2.gif


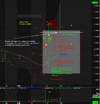
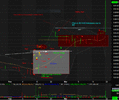
The Next bar is again on very low volume and just hits the V/C Zone.
My patience is running thin Id be raising my stop to .045c

bar analysis 3.gif

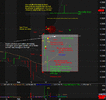
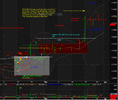
Well the analysis proved to be correct and we are now looking to see how strong
this move is. As Always Im pretty fickle with quick rises Supply will like higher prices

Bar analysis 4.gif


So the next few bars are testing the high and failing. Again low volume
BUT with the entire move almost 100% Unless I see another V/C bar
and Zone created Im of the opinion this is going to consolidate and take a pause.

Bar analysis 5.gif

So the creeping up of the stop pays off. I had a little slippage but not a lot of damage
I re set my but at .061 and with a max of 21 trading days as my wait period OR a CLEAR
reversal of trend its sits there. I check all those in this position each day to evaluate.

Bar analysis 6.gif


And It consolidates to a "T"

Entirely ABOVE the Current V/C bar and Zone.
Not testing of the high until NOW

THEN

Bar analysis 7.gif


So Im now in a new Continuation trade with my stop at B/E

Forward a few more days and this is where Im NOW at the trade is still
live all be it on the watch list once again t .088c

Bar analysis 8.gif
 
So in other words, technical analysis doesn't work in an atypical condition like anticipation of mental drilling results? ;)
 
Works well in anticipation —-even showed pretty clearly
How the participants would react.

What it and any other analysis can’t do is anticipate the
size of a move. I think it was pretty accurate as far as sentiment
is concerned.
 
So Not a lot of discussion.
I presume those watching on understand the principals I have shown.

NEXT

Reading Volume

How can I tell if its Supply or Demand ? (withdrawal of supply).

Volume always tells us something about the participants on the day or in the last week or last 5 mins
given a chart to read with volume. It should be read in conjunction with a BARS RANGE and in conjunction with the last 5 bars of VOLUME and 1-20 bars of PRICE ACTION. In other words ----

CONTEXT.

The best way to explain is with a chart and notes. It takes some experience but is well worth the effort.

Reading VR 1.gif


So from what we know how would you expect price to move Monday?
What would you be looking for if you were holding this and deciding to stay in or get out?
If you wanted to buy this what would be a strategy?

NEXT More (Different) Examples.
 
So Not a lot of discussion.
I presume those watching on understand the principals I have shown.

NEXT

Reading Volume

How can I tell if its Supply or Demand ? (withdrawal of supply).

Volume always tells us something about the participants on the day or in the last week or last 5 mins
given a chart to read with volume. It should be read in conjunction with a BARS RANGE and in conjunction with the last 5 bars of VOLUME and 1-20 bars of PRICE ACTION. In other words ----

CONTEXT.

The best way to explain is with a chart and notes. It takes some experience but is well worth the effort.

View attachment 122950


So from what we know how would you expect price to move Monday?
What would you be looking for if you were holding this and deciding to stay in or get out?
If you wanted to buy this what would be a strategy?

NEXT More (Different) Examples.
Just to add activity: reading that chart i would not be positive for the open but i am very bad at this game, a consolidation before further climb could be on the card: if i was following that stock, i would probably put a conditional buy should it rises today...
So that's probably not the right answer:-(
Disclaimer: not been able to work on your teaching properly yet, need full screen?
 
QF

Youve made a good point.
You don’t think your answer will be correcut.

There is no “Correct Answer”
You can anticipate a number of outcomes
time will determine “ Correctness”

The aim is to improve TRADE MANAGEMENT.
 
QF

Youve made a good point.
You don’t think your answer will be correcut.

There is no “Correct Answer”
You can anticipate a number of outcomes
time will determine “ Correctness”

The aim is to improve TRADE MANAGEMENT.

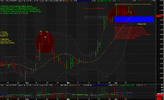
The stock is GNC and I selected it at random (You should be able to see a story in ANY chart.)

Here is my take and not far from QF's

reading VR 2.gif


Cant leave this without making the following comment.

My main concerns are
(1) The high has been tested and failed (Id be out here)
Particularly given the volume
(2) The length of this consolidation
Most continuations come from shorter consolidations
Longer consolidations tend to be distributions at TOPS.
(3) It had a go at continuing from a tighter consolidation
which you can clearly see.
There is a good chance that any trading above the High "Could"
end up being a bull trap.
 
Last edited:
Hi Tech/a,
I like your explanations of trade management regarding protecting profits. When identifying a volume control area, how significantly over the moving average of the volume does your bar need to be to signify a new control area? I also note on this GNC chart that it was a down day, so the volume is more important than a positive or negative move? I think i'd be tempted to take profits here and wait for a possible rebuy on a pullback if it settled around $4.50. Craig
 
P/E

Sorry I was a bit slow---pretty busy ----- as normal.

I will in time do quite a bit on V/C bars and zones.
How to draw them and how to use the information
in them and most importantly trading in them and out
of them.

Little bit more than a one liner.

BUT in quick response. Volume needs to be Greatly different than the average volume
In some that maybe 2x in others 10x an average. I dont use one but if I did Id calculate it between
V/C bars (Which will skew any average). say 20 trading days.
 
Hey Tech,

Not sure if you are up to this stage yet but I'd love to know more on when you take profits. Patterns you look for etc.
 
Morning Bob

Having a bit of a hiatus at the moment.
Life outside of trading is frantic. So Not devoting
the necessary time. Prefer not to do half measures.
Will get back to it. Moving to a 4
day week in 3 weeks and 3 day by end of year.
-------Well that's the plan.
 
Morning Bob

Having a bit of a hiatus at the moment.
Life outside of trading is frantic. So Not devoting
the necessary time. Prefer not to do half measures.
Will get back to it. Moving to a 4
day week in 3 weeks and 3 day by end of year.
-------Well that's the plan.
That's funny I have put the same plan into action.
I even got to a 3 day week for 1 week from the 4.
Now I am back to a 6 day week how did it happen no idea really :confused:
 
Top