Australian (ASX) Stock Market Forum

Gold Day Trading

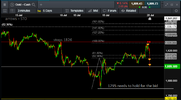
always, but, always, annotate your charts

when price is clustered in a tight zone, no price discovery (break-out to trend) size can be moderated to suit
a balance between account risk and positional risk (or applied risk)

from a risk pov:
youre most likely to lose more with a 10 on a trend swing than a 20 in a cluster, price is far more likely to come back to your
entry level in a cluster rather than impulsing away, achieve less points on higher lot with less or equal risk
it may be dumb for some players to raise risk in a tight zone, it may seem dumb, sure,
scaling in a tight zone changes risk profile versus holding for a trend swing, when price breaks away from a vpoc zone
a 10 can be losing significantly more than a 20 scaled in a tight zone, not just in term of $ and time but in terms of the affect on you
so if you chase a top and a bottom just using a 10 you can destroy your account in a very quick time, bid a top, offer the bottom
your emotive decision making that makes your buy a top and sell a bottom is adrift from a practiced applied trade in a zone

and youre gone especially on margin, zonal trades scaled in, scaled out, you can inspect your win/loss while lowering applied risk,
..when sitting waiting for a trend to get underway there is nothing to inspect, you have to wait for price to give you permission to take action youre far more likely to look for reasons external to price to feel better about the position youre (stuck) in

especially with PM's where the 'value' is so ....flexible

applied risk outweighs trend ideas in probabilities for one simple reason: trend trades or trend swings maybe less than 20%
for any given instrument in terms of time, youre not trading the time but you can get caught by a time frame, the time frame is
obsequious because it is an unconscious shift of proficient trade practice to making allowance for being in a position your unconscious tells you is probably wrong, if you think about all the players who bet on higher highs in early 2011 when every print and guru on the planet was extolling the virtues of gold, for landlords charging rent in gold bars and gold ATM's and how many central banks were filling their vaults that background would have served well to destroy several years of holding a diminishing position until price finally came back to the entry level, that's a lot time given away

trend is merely the string between the zones that make the context, critical , if youre waiting for
the string length to give you context youre enslaved to the time required to have that context print, which is fine when there is an additional remuneration along the way
keep in mind there is a huge difference between buying and bidding, between offering and selling
there is only a "huge amount of buying" when the print hits, once that buying is done the auction finds a different value level
yet we can still define where the largest buyers printed and where the least amount of sellers thought they were getting value sells

in zones the number of systems in use rises, more players interact, more systems will be successful simply because theyre engaging
in an auction that is trying to find the boundaries of value before there is a largesse agreement and we move onto the next zone, so
those systems can make their edge within the framework of the zone, maybe by coincidence than strategic understanding

this difference between understanding bids versus buys and offers versus sells is vital, it is how we can understand when a thin area
is - counterintutively - a rejection area of the current move, or, it becomes the air pocket (applicable to both directions of strength),
where price gaps, there is no gap there in terms of a printed bar but in terms of the rejection level, there's no one there to participate
so at the point in time there is a pivot in value, the players that participated previously are gone, value must move on

the gang that drove price up in a tight zone are not likely to be the size that takes price back down

if every trade is about a winning run then every trade becomes a higher risk in both $ risk and time risk and your disposition

the heading always your annotate charts is what made me start this jaunt, this opener maybe
fragmented to read, a lot like a jazz player who goes into a lead break, you have no idea where she/he's going but you know he'll come out in the right key, the point is, there is no point in putting up a chart unless you annotate it with your thoughts, a blank price chart only leaves the other viewers confused, or, worse, they think you see what they see, which us usually not the (concise) case and you have no way of referring to that little nugget of insight or no way of referring to that "jeez, wtf was i thinking there?" after you have an ah-ha moment
..ah-ha moments are not entirely systems-driven, sure, but unless youre mechanical you need those moments of insight that are about context and relative size. algo's dont have context.

the more you annotate your charts the more you see about yourself, when you review those charts, your moving picture diary....
it's not about knowing when youre wrong it is about knowing if youre widening your risk against yourself or narrowing the same risk
......the risk never changes it is merely dynamic to your understanding within the next time frame, annotating your charts allows you
to be present to that dynamism, this, i say, is relevant to anyone laying a bet in an auction regardless of the instrument and the time frame

---------------------------------------------
an unfinished jaunt
---------------------------------------------

please, join in, have a say......
 
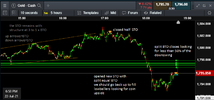
went a little further, took heat on the extra STO, BTO were insurance, lowering risk, auction not finding support upwards,
original 30 pared to 25, still looking for price descension, a tweedle dee day
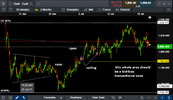
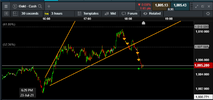
xauusd BTO x STO 220721 iii diary progress .png
 
some of the annotating on the charts allows a recall, not all the trades are annotated, there is not enough time, review and update later while fresh

the risk is being pared as much as possible to allow the anchor to "trim" off the risk as price moves away, nailing down which time frame to pursue in this instance is vital, there's no DOM to work from, the auction appears sloppy but it's structure gives a positive expectation, even so, it is dumb not to
take the receding swings and be most attentive to them given they are against the value search the auction is going thru, it is far more likey that an impulsive rejection of the buyers in the current structure with a series of hooks from MM's and chancers with the bid

if the set-ups are good they are worth reviewing several times
and reviewed in context themselves, refers to structure and intent within the auction, currently the auction is printing a B down,
deceptive builds, two important roles come from annotating, seeing the self in hindsight, so i can transfer that into foresight by
reviewing that which works well regularly and seeing which repetition of habit that raises risk and make a plan how to lower that risk
the more reviewing about those habits the more those habits get exposed as i am about to execute the bad ones, the good ones i review much more to get them in my head as tho the trade is live again,
 
:giggle: i only use the cloaking device when praising government , i don't want to embarrass my friends

PS i was joking .. just in case you didn't guess
 

i think this is important to figuring if youre about to buy a bargain (as price slumps) or if your buying a discount that just keeps discounting

day trading may seem innocuous and superfluous to investors yet we are in the same boat, youre looking for the undiscovered country while i'm looking for the leaks in the hull,

at least by inspecting those leaks once in while you can figure if youre going to make it to shore...
...and i absolutely promise that was the last lame analogy from me (i've got boatloads .....ha, a pun too !!)

coffee
I'm too old and slow to catch gold moves intraday... either that or I'm distracted, reading crap on twitter.

So I'm just accumulating.
 
well i can't blame Twitter , but would rather gold stocks and hold them for months or longer , some of them take a while but can more than double in price , divs ( from some of them ) , plus all the excitement of a rigged commodity .. more fun than TV
 
what makes a rejection area, rejection of price direction, rejection of sellers by buyers
liquidity has two directions
if i were looking for an investment entry based on this what level would suit best to enter
what level offers best insight about intent?
when price hits the vpoc buyers enter yet price has failed to make new headway, does this tighten or widen the risk
what constitutes "consolidation" as it is not a thing specifically merely a summation after price moves away from
that area of doing business

the more price consolidates the higher the risk to buyers (in this instance), one failed rejection of sellers and prior buyers
have no influence, they are filled, with no new liquidity on the buy side, by slightly more selling than buying, price finds a new
area

that is what creates a gap n go (either direction) the gap does not appear on the chart if merely a handful of players create a print,
however, it is a gap by definition of acceptance, so interpretation of acceptance, or rejection, above or below the "consolidation", is the
decider on exiting, if opposed positionaly waiting for the next series of rejections to build a profile
a small gap n go is good for buyers if that move gets rejected too, a swift pickup by deep pockets, that should allow the trader time to
wait for the next rejection or acceptance based on price and the time taken to rejection that move, if price does not rotate back to the consolidation area that does not mean pile in on the new direction, it means the trader needs to shift from being directional-only to balancing the risk both ways, the difference between a puke and a break-out, the difference between acceptance or rejection of that move, is a context of it's own, if the trade is based on that context rather than the preference the trader is disposed to then the risk is attenuated
(this does not consider the positive expectancy pov, albeit, attenuating risk itself is a positive expectancy)

the worst sell is the meandering B sell, looks like a bid kicked in but it's merely presents an opportunity to sell that strength
without leaning, institutional sellers especially want price to come to their level which is what creates immeasurable yes/no trade
the bids kick in but it does not reach the level that major seller want, so they must now go down to where price is reaching and begin to distribute lower, they have to accept a lower value

the point is, again, annotating this on a chart and reviewing allows you to see something that you have not seen before, even if it merely
extracts you (by logic) from engaging in the auction, if you find you are getting trapped, you own the logic, you become a witness, you now own the evidence, you now protect with your emotive stance about that logic, the logic becomes your emotive logic even if this shifts you back into a "balanced" state of thought, you yourself are always swinging between these extremes

you have created a live positive expectancy for yourself with this simple step of annotation, you are "better" risk manager

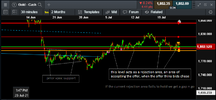
as an example in real time
xauusd gap n go idea 230721.png
 
Top