- Joined
- 28 December 2013
- Posts
- 6,392
- Reactions
- 24,319
It's OK as long as you refer to yourself in the third person.
It's OK as long as you refer to yourself in the third person.
“Hard To Be Humble”
The lyrics of this song never go stale & only Willie Nelson could sing the song perfectly.
"Oh Lord, it's hard to be humble
When you're perfect in every way
I can't wait to look in the mirror
'Cause I get better lookin' each day
To know me is to love me
I must be a hell of a man
Oh Lord, it's hard to be humble
But I'm doing the best that I can"
Skate.
Hi everyone, I've been playing with amibroker rotational strategies this last week. Playing with the concept of dual momentum.
I came across this youtube tutorial, where the presenter uses python to run a backtest on a rotational strategy. Python is not ideal for this type of analysis but I am struggling to work out how to replicate the strategy is Amibroker.
Strategy:
Watchlist = NASDAQ 100
First Rank all tickers by their 200 day ROC and take the top 50 stocks from this ranked list
Rank these top 50 stocks by their 100 day ROC and take the top 25 from this 2nd ranked list
From this final list of 25 stocks, Rank them by their 50 day ROC and take the top 10 stocks
Buy all 10 tickers with equal weighting, ie 10% each.
Rotate Monthly.
I found a tutorial by Matt Radtke, also worth a look for those interested:
I've transcribed the amibroker AFL in his video. I think the secret will lie in a nested for loop where we generate separate static variables for each ROC... ie ROC200, ROC100 and ROC50.
ROC100 = iif( rankROC200 > 50, -1e9, ROC(C,100) );
Below is Radtke's code:
C++:#include_once "Formulas\Norgate Data\Norgate Data Functions.afl" doTrace = False; tkIndex = "$SPX"; // Perform opeations that only need to be done once at the start of the analysis if (Status("stocknum") == 0 AND Status("actionex") != actionPortfolio AND Status("actionex") != actionExAAParameters){ // Find the most oversold members fof the S&P500 index by rankinn in order fo the lowest rsi(2) StaticVarRemove("RSI2*"); StaticVarRemove("RankRSI2*"); SymList = CategoryGetSymbols(categoryWatchlist, GetOption("FilterIncludeWatchlist")); for (i = 0; (tkSym = StrExtract(SymList, i) ) != ""; ++i){ if (doTrace) _TRACE("Setting ranking info for symbol "+tkSym); if (SetForeign(tkSym)){ rsi2 = RSI(2); // Only rank stocks when they are in the index inIndex = NorgateIndexConstituentTimeSeries(tkIndex); RestorePriceArrays(); StaticVarSet("RSI2"+tkSym, IIf(inIndex,100-rsi2,-1e9)); } } StaticVarGenerateRanks("Rank","RSI2",0,1224); } // Get the relative rank for the current symbol // Highest ranking value will have a rank of 1 rsi2Rank = StaticVarGet("RankRSI2" + Name()); // Retrieve the original value used for ranking if needed? rsi2 = StaticVarGet("RSI2" + Name()); // Use the rank as part of your entry code
I'm just wondering if anyone has already experimented with this concept? All thoughts welcome
Notes:    Three Ranks idea: From youtube channel

Import:    // assumes Platinum subscription level
    DataSource:    Norgate
    IncludeList:    .NASDAQ 100 Current & Past
    IncludeList:    SPY // for bull market indicator
    Constituency:    $NDX // include Nasdaq 100 index constituency data
    StartDate:    1/1/04
    EndDate:    Latest
    SaveAs:    ndx_rotate.rtd

Settings:    DataFile:    ndx_rotate.rtd
    StartDate:    Earliest
    EndDate:    Latest
    BarSize:    Daily
    UseAvailableBars:    False
    AccountSize:    100000

Data:    uptrend:    c > Avg(C,200)
    bullmkt:    Extern($SPY, uptrend)
    roc252:    ROC(C,252)
    roc126:    ROC(C,126)
    roc63:    ROC(C,63)
    canhold:    InNDX and bullmkt and C > 10 and uptrend
    rank1:    #rank (canhold * roc252)
    rank2:    #rank ((rank1 < 50) * roc126)
    rank3:    #rank ((rank2 < 25) * roc63)

    posrank:    rank3

Parameters:    positions:    10
    worstrank:    10 // set to > 10 to hold positions longer, set to 0 for monthly rebalance

Strategy:    ndx_rotate
    Side:    Long
    Quantity:    100 / positions
    QtyType:    Percent
    MaxPositions:    positions
    EntrySetup:    EndOfMonth and  canhold and posrank <= positions
    EntryScore:    roc63
    ExitRule:    EndOfMonth and (posrank > worstrank or not canhold)


Honestly, most of us have an opinion of the Market but non of us dare to voice it loud.Most markets going down, it's wait and see time. That is, see if if stops or keeps on going.
Good evening Rabbito some half right and some half wrong !!!!Hon
Honestly, most of us have an opinion of the Market but non of us dare to voice it loud.
50% of experts claim this is one hell of a fall.
The other 50% claim that everyone in the Stock market will be Standing naked except with our underwears.
Impressive, thanks for posting.Hi all,
I just wanted to give some follow up to this post I put up a while back.
A very kind chap sent me an private message suggesting that what I was trying to do (with difficulty!), could be done quite easily in a program called REALTEST or RT, I had not heard of it and was dubious as always... I've been using Amibroker for 10+ years now but intrigued I found the youtube channel mhp trading which demonstrates the program and I have to say... (WOW)
I'll be purchasing the software as soon as my free trial (30 days) is up...
My summary of the software is quite simple. Its Amibroker but without all the annoying stuff...
- want to backtest over current and past symbols - no worries, one line of code
- need to make sure you have no future leaks with entry prices, exit price sequence for limit orders etc - no worries, the backtest engine does that automatically
- documentation - great
- examples and tutorials - great
- support forum - had a quiery - was answered with example scripts with hours (was not belittled in the help forum - a nice change)
- backtest speed --> gives amibroker more than a run for its money.
- cost --> roughly same as amibroker for a single license.
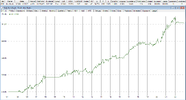
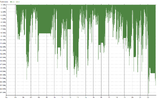
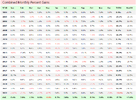
I've attached a RT script which I think does what I was trying to do in ambroker... I'll leave it to you to decide which looks simpler!
Hope this helps... I am in no way affilliated with RT, just wanted to give this software and the developer the credit which I think is thoroughly deserved.
Horses for courses, I'll still use Amibroker and Python when they are the best suited for the job.
Cheers
C++:Notes: Three Ranks idea: From youtube channel Import: // assumes Platinum subscription level DataSource: Norgate IncludeList: .NASDAQ 100 Current & Past IncludeList: SPY // for bull market indicator Constituency: $NDX // include Nasdaq 100 index constituency data StartDate: 1/1/04 EndDate: Latest SaveAs: ndx_rotate.rtd Settings: DataFile: ndx_rotate.rtd StartDate: Earliest EndDate: Latest BarSize: Daily UseAvailableBars: False AccountSize: 100000 Data: uptrend: c > Avg(C,200) bullmkt: Extern($SPY, uptrend) roc252: ROC(C,252) roc126: ROC(C,126) roc63: ROC(C,63) canhold: InNDX and bullmkt and C > 10 and uptrend rank1: #rank (canhold * roc252) rank2: #rank ((rank1 < 50) * roc126) rank3: #rank ((rank2 < 25) * roc63) posrank: rank3 Parameters: positions: 10 worstrank: 10 // set to > 10 to hold positions longer, set to 0 for monthly rebalance Strategy: ndx_rotate Side: Long Quantity: 100 / positions QtyType: Percent MaxPositions: positions EntrySetup: EndOfMonth and canhold and posrank <= positions EntryScore: roc63 ExitRule: EndOfMonth and (posrank > worstrank or not canhold)
View attachment 150720
View attachment 150723
View attachment 150721
Good Job Willzy.Hi all,
I just wanted to give some follow up to this post I put up a while back.
A very kind chap sent me an private message suggesting that what I was trying to do (with difficulty!), could be done quite easily in a program called REALTEST or RT, I had not heard of it and was dubious as always... I've been using Amibroker for 10+ years now but intrigued I found the youtube channel mhp trading which demonstrates the program and I have to say... (WOW)
I'll be purchasing the software as soon as my free trial (30 days) is up...
My summary of the software is quite simple. Its Amibroker but without all the annoying stuff...
- want to backtest over current and past symbols - no worries, one line of code
- need to make sure you have no future leaks with entry prices, exit price sequence for limit orders etc - no worries, the backtest engine does that automatically
- documentation - great
- examples and tutorials - great
- support forum - had a quiery - was answered with example scripts with hours (was not belittled in the help forum - a nice change)
- backtest speed --> gives amibroker more than a run for its money.
- cost --> roughly same as amibroker for a single license.
I've attached a RT script which I think does what I was trying to do in ambroker... I'll leave it to you to decide which looks simpler!
Hope this helps... I am in no way affilliated with RT, just wanted to give this software and the developer the credit which I think is thoroughly deserved.
Horses for courses, I'll still use Amibroker and Python when they are the best suited for the job.
Cheers
C++:Notes: Three Ranks idea: From youtube channel Import: // assumes Platinum subscription level DataSource: Norgate IncludeList: .NASDAQ 100 Current & Past IncludeList: SPY // for bull market indicator Constituency: $NDX // include Nasdaq 100 index constituency data StartDate: 1/1/04 EndDate: Latest SaveAs: ndx_rotate.rtd Settings: DataFile: ndx_rotate.rtd StartDate: Earliest EndDate: Latest BarSize: Daily UseAvailableBars: False AccountSize: 100000 Data: uptrend: c > Avg(C,200) bullmkt: Extern($SPY, uptrend) roc252: ROC(C,252) roc126: ROC(C,126) roc63: ROC(C,63) canhold: InNDX and bullmkt and C > 10 and uptrend rank1: #rank (canhold * roc252) rank2: #rank ((rank1 < 50) * roc126) rank3: #rank ((rank2 < 25) * roc63) posrank: rank3 Parameters: positions: 10 worstrank: 10 // set to > 10 to hold positions longer, set to 0 for monthly rebalance Strategy: ndx_rotate Side: Long Quantity: 100 / positions QtyType: Percent MaxPositions: positions EntrySetup: EndOfMonth and canhold and posrank <= positions EntryScore: roc63 ExitRule: EndOfMonth and (posrank > worstrank or not canhold)
View attachment 150720
View attachment 150723
View attachment 150721
 www.aussiestockforums.com
all my legacy and knowledge is with AB but all I ever read about RT is flattering..I need to bite the bullet and give it a fair go.Good Job Willzy.
I've been using RT for a number of years, I was a beta user so it has evolved ALOT since it went live. Feel free to post in this thread to spread the word about the awesome piece of software.
RealTest - Portfolio Level backtesting software
He's very good at accommodating suggestions and solving people's problems that may arise.www.aussiestockforums.com
Impressive, thanks for posting.
How does it go on the ASX 20, 100, 200, All Ords, entire market with say turnover of $40mill/month?
Very nice presentation. Thanks for sharing the code with us.Hi Gringotts, I wasnt sure how to set the max turnover to 40mil/month.... (I'll keep searching) here are the results for the ASX100 200 and 300, surprisingly the 300 was best.
Very early days for me with RT but I don't think I've made any shocking errors!
Survivorship bias is accounted for.Very nice presentation. Thanks for sharing the code with us.
Is survivorship accounted for? Was there any optimization used?
Skate this latest post is so true. It is something the late scumbag Alan Bond told me many years ago when I was working on his daughter's place in Brigadoon. Never borrow a peanut, always go for a bag full and let the lender have the headacheInterest Rates & Debt
Self-responsible & personal accountability for the choices we make form the solution.
View attachment 150748
Skate.
This isnt tradeable for me in its current form.

Willzy, thanks for the backtest results. I wouldn't look for a better edge. The one you've got right there is quite impressive already.
But here are some troubling concerns:
- most of the profit happened before 2010
- 2003-2007 was the "genius-maker-market" when anything would have worked
- notice that the entire gains in 2008 came in one month, May, and the system was conveniently out of the market the rest of the year. You might say that the index filter kept you out but the XJO was decisively below the 200-day MA during all of 2008 and until June 2009
- the Sharpe Ratio is suspiciously high (the drawdowns are unbelievably low)
Other than that, there are no obvious red flags. The returns since 2010 are plausible, just that I would expect much bigger drawdowns.
Is it even possible that such a simple and obvious scheme could produce double the buy-and-hold returns with a fraction of the drawdown?
Let's assume that it works. A position size of $20,000 for ASX100 stocks would be appropriate with minimal market impact. This requires a $200,000 portfolio.
Now, it would be reasonable to expect the rebalancing to work not only on the last day of each month but on the first and the second, the third, etc., any of the 21 trading days. It would be a very bad sign if it didn't.
So, we could manage 21 tranches of $200,000 making a $4,200,000 portfolio,
Not only that, but we don't have to only trade at the Open or the Close; why not every hour? Even every 15 minutes. Why not? Liquidity shouldn't be too much of an issue as we invest in ASX100 stocks only.
It's going to be a full-time-job but we could manage a $50 million or even a $200 million portfolio.
Why hasn't anyone thought of this?
Oh, I know, they haven't got $200,000,000. Of course.
BTW, do you know about the MarketIndex Top 5 system? Maybe that was your inspiration. Worth checking out.


Hello and welcome to Aussie Stock Forums!
To gain full access you must register. Registration is free and takes only a few seconds to complete.
Already a member? Log in here.