Australian (ASX) Stock Market Forum

Dump it Here

Education is something that is done to you. Learning is something you do for yourself.
You should continually seek further knowledge. You can read almost any trading book that has been written and discover gems in them. Yet most people fail to follow them because they forget or are undisciplined to action them. If what you learn leads to knowledge, you become a fool - but if what you learn leads to action, you can become wealthy.

Before we move on
I've said it before & I'll say it again, "backtesting is only part of the equation" when it comes to system development. What matters is out-of-sample system performance. It is the realistic estimate of how the system would work in real trading & will quickly reveal any curve-fitting issues. If out-of-sample performance is poor then you should not trade such a system.

Walk forward test
This is an Amibroker built-in function that validates system design, I'm suggesting everyone use it.


Amibroker questions
When you are unsure or have a question, Amibroker has a well-documented "User Guide" with an extensive "Knowledge Base".


Summary
When it comes to trading, "don't be lazy". When your money is on the line this is when trading gets really serious. Tough times are often the time a strategy is quickly abandoned. Commitment & focus on the long term is more important than focusing on short-term price volatility.

Skate.
 
Larry Connors TPS, just plodding along on NAS100 index, only problem is due to the scaling in, these trades are only small winners...


Untitled.png


Here's the tradeStation easyLanguage code for anyone who wants it:

C++:
inputs:
    fullPosition(1000),
    TradeLong(true),
    tradeShort(true),
    useMovingAverage(true);
    
    
variables: 
    
    // Indicators
    sma200(0),
    osc(0),
    
    currentPos(0),
    totalPos(0),
    lastEntryPrice(0),
    
    // Position Sizing Variables
    numShares(0);

// Turn Off IntrabarOrderGeneration   
[Intrabarordergeneration = False]

// Run Main Calculations

sma200 = Average(Close,200);
osc = RSI( C, 2 );

// Calculate PositionSize

numShares = round( fullPosition * 0.1 / Close[1], 0);

// Long Only
if tradeLong = true then Begin
    if( useMovingAverage = false or close > sma200 ) then begin
        if osc<25 and osc[1]<25 and currentcontracts = 0 then begin buy numShares*1 contracts this bar at close; currentPos = 1; totalPos = 1; lastEntryPrice = close; end;
        if close<lastEntryPrice and currentPos[1] = 1 then begin buy numShares*2 contracts this bar at close; currentPos = 2; totalPos = 3; lastEntryPrice = close; end;
        if close<lastEntryPrice and currentPos[1] = 2 then begin buy numShares*3 contracts this bar at close; currentPos = 3; totalPos = 6; lastEntryPrice = close; end;
        if close<lastEntryPrice and currentPos[1] = 3 then begin buy numShares*4 contracts this bar at close; currentPos = 4; totalPos = 10; lastEntryPrice = close; end;
    end;       
    if currentPos > 0 and osc >= 70 then begin Sell all contracts this bar at Close; currentPos = 0; totalPos = 0; lastEntryPrice = 0; end;
end;

// Short Only
if tradeShort = true then Begin
    if( useMovingAverage = false or close < sma200 ) then begin
        if osc>75 and osc[1]>75 and currentcontracts = 0 then begin sellshort numShares*1 contracts this bar at close; currentPos = -1; lastEntryPrice = close; end;
        if close>lastEntryPrice and currentPos[1] = -1 then begin sellshort numShares*2 contracts this bar at close; currentPos = -2; lastEntryPrice = close; end;
        if close>lastEntryPrice and currentPos[1] = -2 then begin sellshort numShares*3 contracts this bar at close; currentPos = -3; lastEntryPrice = close; end;
        if close>lastEntryPrice and currentPos[1] = -3 then begin sellshort numShares*4 contracts this bar at close; currentPos = -4; lastEntryPrice = close; end;
      end;
    if currentPos < 0 and osc <= 30 then begin Buytocover all contracts this bar at Close; currentPos = 0; lastEntryPrice = 0; end;
end;
 
Last edited:


Read this, it's important
"Position sizing
defines position sizing method used by MC simulator in "trade list" mode:

Don't change - uses original position size as used during backtest. Keep in mind that it always uses original dollar value of the trade (or whatever currency you use), even if your formula is using percent of portfolio equity.

Fixed size - uses fixed number of shares/contracts per trade

Constant value - uses fixed dollar amount for opening any trade

Percent of equity - uses defined percent of current simulated equity value. Be careful when using this setting - it causes that position size of one trade depends on profits on previous trades (compounding profits) and creates serial dependence. It may also lead to extra compounding effect when you have overlapping trades in your original backtest as bootstrap performs trades sequentially (so they don't overlap). For this reason its use is limited to cases when no overlapping trades occur".


Skate.
I still don't get it.

When I do a backtest, AB prints only one equity curve and one backtest report. When I look at the MC chart, there's say 1000 other runs (based on shuffling the order of trades), but I don't see what that has to do with anything. There's a piece of the puzzle I'm missing...what is it?
 
There's a piece of the puzzle I'm missing...what is it?

This is it in a nutshell

If you can't see the problem, there is no answer.

I suggest you ask @Nick Radge why the two backtests are so different.

WTT side by side Results.jpg

Or ask Nick a simpler question
Why have the results for the year 2000 changed so dramatically?

COMPARE.jpg

To make it a little easier for you to understand
Look & compare the information contained within the red circles, particularly February, March & year to date. If things are still unclear go back & slowly read what I have written previously.

COMPARE2.jpg
Don't post one-liners
Most members ask questions or post a response making a statement as a one-liner, (not all but some) & sometimes their responses are the same, it's unhelpful. If you skim-read my post you'll learn nothing & at times you will "completely miss the point" of what I was trying to get across by jumping to the wrong conclusion.

It takes time
It takes a lot of time & effort to give a "measured response" so all I'm asking is "if you have a question detail it precisely", let me understand why you don't understand as constantly going back & forward with others is tiresome, boring & more importantly, it wastes our time.

Skate.
 
Last edited:
This is it in a nutshell


I suggest you ask @Nick Radge why the two backtests are so different.

View attachment 150203

Or ask Nick a simpler question
Why have the results for the year 2000 changed so dramatically?

View attachment 150204

To make it a little easier for you to understand
Look & compare the information contained within the red circles, particularly February, March & year to date. If things are still unclear go back & slowly read what I have written previously.

View attachment 150205
Don't post one-liners
Most members ask questions or post a response making a statement as a one-liner, (not all but some) & sometimes their responses are the same, it's unhelpful. If you skim-read my post you'll learn nothing & at times you will "completely miss the point" of what I was trying to get across by jumping to the wrong conclusion.

It takes time
It takes a lot of time & effort to give a "measured response" so all I'm asking is "if you have a question detail it precisely", let me understand why you don't understand as constantly going back & forward with others is tiresome, boring & more importantly, it wastes our time.

Skate.
One point which is slightly confusing and needs confirmation:
when you put a dataset like this:

1670402895968.png
What you mean as I understand it :
before the latest backtest results provided this month for Nick system, the 2000 BT results were the first row 41.98% annual profit?

whereas at the last update report this month, for the same year and system:
we got the second row results 19.6% annual profit?
As this is probably what puzzles Monsieur @Gringotts Bank
Am I right GB?
 
Good evening Skate
rcw1 went fishing today. Hot and humid as … 36 C mercury hit… reckon was even hotter out there amongst it in the mangroves.

Just rcw1 and his boat.

Took an IPhone, better half makes rcw1 take it these days, makes her happy in mind should anything happen rcw1 would able to ring for help… Happy partner happy life .., Nice touch, just beautiful , but wouldn’t make any difference mostly no signal. Ha ha ha ha

Foolish pig headed ???

For mine rcw1 knows the tides, the river, the country, the boat and moves and thinks steady Freddy :) Like ‘football has been good to me’ ha ha ha ha

The thing is Rcw1 had a plan, before he left where he was gunna get bait and where rcw1 was gunna anchor up and float the livies out … recreational fishing oh the joy of it.

rcw1 told another fisherman exactly what he was doing and that fisherman knew exactly what rcw1 was saying. Important as …

That person knew exactly where to find rcw1 should he fail to rock up 2 hours prior to dusk..

Traders need a plan every day along with a hand full of contingencies to combat our dynamic market.

Easy as going fishing.

Perhaps you are wondering whether rcw1 caught anything?

Yep of course rcw1 did, the plan worked today :)

Have a very nice evening.

Kind regards
Rcw1
 
What you mean as I understand it :
before the latest backtest results provided this month for Nick system, the 2000 BT results were the first row 41.98% annual profit? CORRECT

whereas at the last update report this month, for the same year and system: we got the second row results 19.6% annual profit? CORRECT

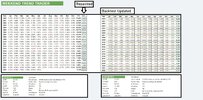
This is "The Chartist" original Backtest of the "WTT Strategy"
Let's be clear, I'm only uploading information "The Chartist" has supplied. The ORIGINAL backtest was only current up to the end of June 2022, I kindly asked if the backtest report could be updated. Nick said he would have the backtest chart updated at the end on November 2022, which was fair enough.

WTT Results.jpg

@Nick Radge was good to his word & had the "WTT Strategy" backtest results updated
But on inspection, the two backtests reports before being updated & after being updated the backtest results have "completely changed" making the point of the exercise less than useless.

Uploading reports
I made the remark a "few posts back" that if you are going to post results make sure the backtest results are accurate, constant, believable, achievable & repeatable. That is not too much to ask from a business with something to sell.

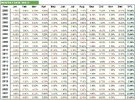
This is "The Chartist" UPDATED Backtest of the "WTT Strategy"
To show the performance difference between the two backtests, being the ORIGINAL backtest compared to the "LATEST UPDATED" Backtest. The results IMHO are laughable.

YTD to NOV.jpg

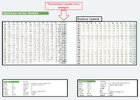
Compare the pair
So you understand what I'm talking about, look at the side-to-side comparison of the two backtest results. I even went to the trouble of pasting the "CHANGE" YTD results so you could see the screaming discrepancies. If the capture is too small to read, click on the graphic to expand it.
WTT side by side Results.jpg

Skate.
 
Don't think anything to do with the built-in Amibroker charts.
I'm guessing AB code using optimise to create multiple monte carlo runs and data dumped in a spreadsheet.

I'm sure @Nick Radge will want to clarify why there are discrepancies between the two backtests
I've written a series of posts on the different ways to backtest with screen captures uploaded to explain why only one method is acceptable. The screen captures that I uploaded in that series of posts display practical examples of why backtesting any other way skews the results.

There is only one method that achieves consistent, accurate & believable backtest results

I even supplied the Amibroker hyperlink as to why backtest results vary between runs. Amibroker explains in plain English how to achieve consistent results. To understand this better refer back to my previous post today & don't speed read or you won't memorise the important bit.

Skate.
 
Good evening Skate
rcw1 went fishing today. Hot and humid as … 36 C mercury hit… reckon was even hotter out there amongst it in the mangroves.

Just rcw1 and his boat.

Took an IPhone, better half makes rcw1 take it these days, makes her happy in mind should anything happen rcw1 would able to ring for help… Happy partner happy life .., Nice touch, just beautiful , but wouldn’t make any difference mostly no signal. Ha ha ha ha

WAY off topic BUT

You NEED one of these

https://www.bcf.com.au/p/acr-resqli...-EWankLod7q1FPgcAoIaAq4sEALw_wcB&gclsrc=aw.ds
 
While I'm off topic.

Has anyone else played with this ?

https://chat.openai.com/auth/login

It's not often that i'm impressed with something new, but this thing is Freaking insane. It's a chat bot that's built on AI, but you can honestly have a conversation with it about any topic in the world, Including trading.

I started putting in some c++ code, it analysed it and told me where some optimizations would be. I then asked it to modify my code to allow it to do something else and it did it for me. It understood my needs and could update my c++ code for me.

I asked it if it could trade, It told me it couldn't because it doesn't have access to market data. ( guess the developers are keeping that to themselves). After a few dozen questions it told me that it could successfully teach itself to trade if it had access to the correct data.

If anyone wants to see what the next decade will look like. This is it !

And I am scared !!!
 
I just logged into the AI chat again.

The difference now since this mornings update is like day then night, it seems as though the developers have toned it down massively. Where it would analyse and guess what you wanted, with precision, now it just says i don't know and gives big verbose answers telling you it's just a program. Totally different and really boring. It's like pulling teeth to get a response now.

Guess the developers got a little scared too !!!
 
What about this strategy
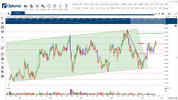
Buying at support & selling at the resistance level. Now at face value, this strategy looks like a rip-snorter. But alas not so, "as far as I'm concerned". Let's look at the weekly chart of (ASX:ALU).

How could this strategy possibly fail?
Looking at the chart below you would start to believe this idea has legs. But unfortunately, not so.

View attachment 150125


Skate.
Skate, what's your problem with ALU?
I accept it could (and has) fallen back a little from resistance but my view was that while the stock is quite volatile and has been trading in a range of about $20 or 50% of its recent highs and should (but doesn't have to continue up to the top of the shaded channel as it has previously. The recent rise to resistance at $38, a pull back and then another try at $38 suggests to me a good chance it will break through - in which case it should make $43. In July the stock broke above a weekly downtrend line and since then it has been generally making higher weekly troughs and peaks and confirmed a new weekly uptrend - all of which are buy signals in my book. These are still volatile/difficult times for trading and whether my decision to buy ALU now was good, bad or indifferent - only time will tell. As we both know there is no magic strategy in share trading. All the best for the Silly Season by the way.
PS: I thought a Santa rally might be happening but interest rate and energy concerns seem to have poked the Ol' Fella in the eye for now.
1670472770170.png
 
What about this strategy
Buying at support & selling at the resistance level. Now at face value, this strategy looks like a rip-snorter. But alas not so, "as far as I'm concerned". Let's l

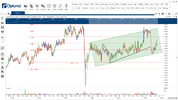
Here is another (ASX:ALX)
Looking at the chart below you would start to believe this idea for a strategy has legs. But unfortunately, not so.

View attachment 150126

Skate.
Skate, You might be right with ALX but it is a stock that has shown good growth in past years and there's a possible price channel that suggests a rise back to the low $8 mark is possible. The oil price could be the problem for this stock.

1670473723875.png
 
Skate, what's your problem with ALU?

@Greynomad99 you misunderstood the point of the post, it was all about explaining a simple "Support & Resistant Strategy". I explained that buying between the lines is not all it's cracked up to be. The idea was about buying at one line & selling at another. Looking at the lines in the chart you would believe the strategy would have legs, but it doesn't.

There is no problem with ALU, that is not what the post was about
So I don't get accused of cherry-picking (when I post) I will use companies that are being talked about. If the first two were ANZ & BHP I would have used those two companies to display the "Support & Resistant" lines. It was never about ALU. It was just convenient to use that company

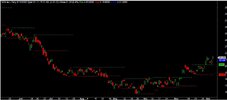
NCM has been bandied about recently
So I'll post a chart of NCM that displays both lines. Buying at one & selling at the other was the premise for the "S&R Strategy".

RECAP: What about this strategy
Buying at support & selling at the resistance level. Now at face value, this strategy looks like a rip-snorter. But alas not so, "as far as I'm concerned".

NCM.jpg


# Sorry for the confusion

Skate.
 
Top