MovingAverage
Just a retail hack
- Joined
- 23 January 2010
- Posts
- 1,315
- Reactions
- 2,565
Happy Friday Y'All,
Well I bang on about making sure you use a statistically relevant number of trades before placing any faith in your simulation results--not enough trades and your results are worthless and too many trades can be a waste of CPU cycles, your time and unlikely to give you any further insight.
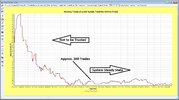
I was recently doing an analysis of a system and was reviewing some simulation charts and thought the below chart highlighted the importance of understanding what the relevant number of trades for your system simulations is. What you see below is the winning percentage of trades over time and I'm just using this as a simple example. This chart was generated using TradeSim and while I would like the X axis to show trade count and not date unfortunately TradeSim only allows me to show date. Nonetheless this is not a big deal as I explain below.
The important thing to note with the chart below is the date range of June to Oct 2018. Prior to this date the simulation has executed less than about 300 trades and obviously after that date the system has executed more than 300 trades. You can see that up to the 300 trade mark the winning trade % goes up than then slowly down to what is referred to as the "system steady state" (300 trade mark around June / Oct 2018) where is settles at around the 58% winning trade level.
What's the big deal I hear you say--well simulating this system with less then approximately 300 trades is a complete and utter waste of time and will only lead to misleading simulation results. Simulating this system with 1000 trades will be a complete waste of time and unlikely to yield any additional confidence in your simulation results. Personally, I think simulating this system with around 500 trades would be adequate to give you a reasonable level of confidence that the system has reached steady state and the simulation results are reasonably insightful.
Please do not make the mistake of saying using only 500 trades would not span different market conditions and therefor you must use 20 years of data--wrong! This is where walk-forward testing on OOS data is important so you can understand how your system performs across all market conditions and how robust (or not, as the case may be) your system is and what market conditions it performs poorly in.
Stay classy ASF.

Last edited:

