Australian (ASX) Stock Market Forum

Dump it Here

I have been and continue to be interested in what @Skate calls his "Stale" stop-loss. I had no idea how to code such a thing, but the idea seems sound. I currently have a few stocks that initially trended strongly higher, but currently are operating in a range. They do seem stale.

I'm trading Weekend Trend Trader which uses 20 week break-outs. I code Donchian(20) channels to visualize that.

In a happy accident, today I noticed that the upper Donchian channel for Amazon had turned lower. So there has been no new high for 20 weeks. This seems to be a reasonable test of staleness for my WTT strategy.

I will definitely code this up and backtest to see whether it acts as an improvement over the existing system.
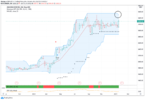
UQIE8v1O.png
 
I have been and continue to be interested in what @Skate calls his "Stale" stop-loss. I had no idea how to code such a thing, but the idea seems sound

@dpong, the StaleStop that I use is much different to the ones below but it will be a starting point for you to evaluate. I notice that you use a Looping trailing stop & would suggest you add this exit as you need to store the bar at entry - so if either is hit (Trailing Stop or StaleStop) it will give you a sell signal.

With an ApplyStop you add the StaleStop to the code.

@Trav. may elect to post using both methods below as (1) inclusion of a StaleStop in a Trailing Stop or (2) inclusion of a StaleStop in an ApplyStop. (give Trav a "PM" & ask if he would have the time)

Simple StaleStop examples
I've quickly coded you two examples using a 5 week period. In English, it means after 5 weeks if the position is not performing we are out of the sucker.
StaleStop = HighestSinceBars( Buy, H, 1 ) == 5;
StaleStop = ROC( Close, 5 ) < 0;

After reading this
You may not need Trav's help.
I will definitely code this up and backtest to see whether it acts as an improvement over the existing system.

Skate.
 
Experience
Therefore the hardest part of trading is learning from experience or time in the market, it's learning how to control your emotions & how to keep persisting even when your account suffers a few losses. It’s about being realistic & having an understanding that we are probably only an average trader at best but that’s okay.
It really is true.
Keep it real and understand it all falls under the "law of averages", and that we need a method to produce results better than "average", when considering the law of averages.
Otherwise we are setting ourselves up to simply break even at best, and taking into account brokers fees, we are likely to go backwards.

Had a few rough weeks on the "stonkier" of my two portfolios, last week was a welcome recovery.
Up the ladders, down the snakes.
Aiming for the "1%" email..(again). BSM is in this portfolio and has been helping results along nicely.

Screenshot_20210125-084933~2.png
 
@Nameless_ made a recent post about what is required to start trading going on to say "I work full time, so I understand I have time constraints learning Amibroker AFL. Given the steep learning curve, I was thinking it may be easier to cough up the 990 bucks for a turnkey code. Cheapest Norgate data is 270 bucks a year, so its hard to know which is the best way to start".

It cost money to make money
Most starting out don't want to spend "any money" to start trading, some only want to spend as "little as possible" - whereas others want to know the true cost of doing business, starting out the correct foot.

What are the setup costs to trade straight away?
New members join our community seeking answers to allay their fears & doubts when it comes to trading.

Setup costs with any new endeavour
As with all-new endeavours, whether its fitness or sport requiring equipment, there is always an initial cost. When starting out you'll tend to spend the least amount as possible, that's just human nature. When you come to the realisation that "it's for you" you can always buy bigger & better later on.

It's precisely the same when it comes to trading
Most beginners want to spend the least amount as possible. Why? because in most cases they haven't got a lot of cash to burn or money they can afford to lose. To "have a go" at systemic trading you need to spend a little before you start, we'll call it "your setup costs".

I'll list what you'll require & what you'll need to buy
Assuming you have a computer with a "Windows Operating System" & internet connection, there is little else required other than the 6 points below & nerves of steel.

1. Amibroker
https://www.amibroker.com/ Amibroker is a Technical Analysis Software that includes Charting. The cost is $359 for the Professional "64bit Edition" that includes 24 months of free upgrades & support. After you purchase Amibroker you'll need an independent data feed. Norgate Data is the perfect companion.

2. Norgate Data
https://norgatedata.com/prices.php The data is only available on a 6 or 12 months subscription-based service. The basic silver subscription package is $148.50 for 6 months, prepaid in advance.

3. Turnkey AFL Strategy
https://www.thechartist.com.au/product-category/turnkey-trading-systems/ The Chartist Turnkey Trading Systems costs as little as $990. All of the Turnkey Trading Systems are specifically designed for Amibroker. Each strategy has been professionally coded.

4. Trade recording software
https://www.aussiestockforums.com/threads/dump-it-here.34425/page-228#post-1107643 - Share Trade Tracker records & analyses your trades & tracks your trading performance. The price "update feature" has a built-in Norgate Data API for accurate record keeping. The total cost is $308.

5. Brokers account
https://www.commsec.com.au/support/frequently-asked-questions/956.html A CommSec CDIA account is a cash management account specifically designed for CommSec share traders, allowing you to access your funds. The total cost to set up an account that allows you to have access to CommSec's trading platform is $0 (Free)

6. Stake money
$20,000 is the minimum amount "to having a go" which allows you to have (20 X $1k bets). Commission cost is an important consideration as @dpong recently quoted "I believe that paying attention to commission drag is important, and especially so with an account of that size"

What have you got to lose?
The most you can lose is your stake money & set up costs, which should be the money you can afford to lose without causing financial hardship.

A summary of the startup cost
Amibroker = $359
Norgate Data = $148.50
The Chartist - Turnkey Strategy = $990
Share Trade Tracker = $308
Stake (Starting Capital) = $20K

The initial cost to trade
$21,805.5 would be your initial outlay & anything less, you are dreaming & not fair dinkum. @qldfrog recently made the remark "anything less should NOT be your focus" - a good point to remember.

Skate.
 
@Skate very nice post mate. I related to each one of those points
I’ll give you my own short experience

I have minimal coding experience, first year uni was about the only time I coded which was along time ago. I realised it’s like learning to ride a bike though you never really forget it. The language is different but the principals remain the same. Not to mention the huge amount of resources available to you. Amibroker documents very well!

Spending money was another point you covered; for me it was “I don’t want to waste this money if I am not going to benefit” I.e make my money back. I started off with the norgate free trial, free version of amibroker, free version of skates WTT (thank you) and that gave me a really good feel for it. I also read the whole “dump it here” thread. Gems everywhere!

I’ll add that I got heaps of support from you guys here special mention to @DaveDaGr8.

once I realised it can be done successfully and after spending hours on it, I purchased the platinum norgate and pro version of amibroker.
I guess the moral of the story is; there is ample opportunity for you to try it for free and if it’s your cup of tea move to the next level. You still need the $20k though :)

I do sometimes get the thought; screw it I am going to purchase the WTT for $990. Haven’t yet though, staying strong :)
 
4. Trade recording software
https://www.aussiestockforums.com/threads/dump-it-here.34425/page-228#post-1107643 - Share Trade Tracker records & analyses your trades & tracks your trading performance. The price "update feature" has a built-in Norgate Data API for accurate record keeping. The total cost is $308.
I'm experiencing some slowdown with the STT especially when using the upload feature. (The initial upload was fast enough)
Some stats:
Period: On and off from 2012
No. Trades: 600~
No. Strategies: 11 (6 are past data)

Do you dump all your trades into the tracker from whenever you started or do you break them up into yearly / strategy chunks?
Also was expecting the per strategy daily/weekly graphs but it was easy enough to create one.
 
Do you dump all your trades into the tracker from whenever you started or do you break them up into yearly / strategy chunks?
Also was expecting the per strategy daily/weekly graphs but it was easy enough to create one.
@silent1a I'm unsure what you question is as your post is conflicting. Are you referring to just the speed (transfer rate) or have you an issue with using the bulk upload feature. If so, are you uploading using the bulk Upload Worksheet or are you a bulk Upload from Interactive Brokers (report output)? http://sharetradetrackerhelp.xlautomation.com.au/support/transfer-data

Hint menu
All menu icons have hint menus & if that fails you can use the help menu.

Chunking data
All files are uploaded in one transfer as there is no need to upload data chunks what so ever.

Speed
If you are experiencing a slower speed than normal, that's another issue entirely. If its a speed issue I suggest you download the latest version 3.5.2. This will also alert you for missing securities that need to be updated manually.

Skate.
 
Last edited:
Speed
If you are experiencing a slower speed than normal, that's another issue entirely. If its a speed issue I suggest you download the latest version 3.5.2. This will also alert you for missing securities that need to be updated manually.
Thanks for the help. Found the issue to be a corrupted workbook probably due to a seemingly stable overclocked PC (Ryzen). I've transferred all the trades to a new workbook and it's working fine now.
 
Sad consolation that my weekly strategy losses are in line with the Master :cool:
Ups and downs
same. past 2 days alone were pretty brutal for my 3 strategies lol. by the looks of my MAP strat I lost 10% in the past 2 weeks. equity curve looks similar to skates so that makes me feel a little happier lol.

Trading
Watching the weekly volatility can sometimes play with your emotions. Every trader needs to remember that trading is a marathon, not a sprint. Some weeks are lemons whereas other weeks are lemonade as there will be good weeks as well as bad weeks. Accept this fact & you are halfway there in controlling your emotions. How you handle your positions while controlling your emotions will eventually decide how successful you will be as a trader. Trading has a high attrition rate when the going gets tough.

Skate.
 
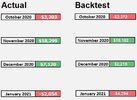
Let's visualise actual results versus backtest results
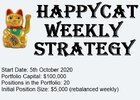
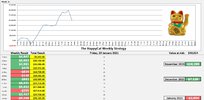
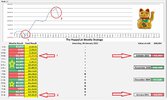
The HappyCat Strategy actual monthly trading results versus the backtest results. The same HappyCat Strategy displaying the monthly volatility.

Monthly results - Actual versus Backtest Oct -Nov - Dec - Jan Capture.jpg


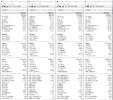
Monthly Backtest Results
4. HappyCat Oct -Nov - Dec - Jan - Capture.jpg

Skate.
 
Let's visualise actual results versus backtest results
The HappyCat Strategy actual monthly trading results versus the backtest results. The same HappyCat Strategy displaying the monthly volatility.

View attachment 119303


Monthly Backtest Results

Very interesting post Skate. Its an interesting challenge which stats you choose to benchmark against, and so easy to get out of sync with your system signals if capital is short or you miss out on a buy offer. Had never considered running a one month backtest for comparison like that. Your systems have tended to be so nimble buying positions we probably should be surprised how close the performances were. From memory there haven't been many sell signals on some of the orignal stocks, so many have held up well versus monthly backtests along the way.
 
Volatility, emotions (fear & greed)
To understand the recent volatility in our markets you only have to read a few of @ducati916 recent posts as to how sentiment drives the markets in general.

Volatility
It doesn’t matter what system you are trading - the best way to handle volatility is to just accept it. Periods of high volatility will always come and go, always has and always will! - Don't jump at shadows - just roll with it

Let's be clear
At the company level, nothing & I mean "nothing" has changed this past week but the share price reflects differently. Volatility drives our emotions (fear & greed) & as trend traders we live & die by it. Market swings are part of the game, sometimes intentionally & other times not so much. For us it's the same game, we hop on "enthusiasm" when the prices are going up & ride it like a bucking bronco. The ride is over when our strategy throws us off the trade. We get back up, dust ourselves off & start over again waiting for the next ride. Trend trading is a rise & repeat game taking advantages of large numbers.

Skate.
 
Let's visualise actual results versus backtest results
The HappyCat Strategy actual monthly trading results versus the backtest results. The same HappyCat Strategy displaying the monthly volatility.

View attachment 119303


Monthly Backtest Results
View attachment 119302

Skate.
Dear Mr Skate, when this happens, i then go a step further: why?
Backtest vs real should match but for known cases: missed buy,missed sell or obliged to sell at market after the open,and human error like typos etc
When they do not match after these corrections, it usually means you are looking forward in the code or similar and the explore results change with time
I do not sleep well with live systems which do not match their backtests after correction for known factors
 
Humans are deeply flawed creatures
All humans are manipulators (some just don't realise it) to get a desired or favourable outcome for themselves (go figure)

What drives share prices
Let's have a direct look at the weekly volatility of ANZ, CBA & BHP. Nothing has changed for these companies in the last week but it's abundantly clear that the market participants were spooked.

Who spooked them do you ask?
Frankly, the other participants, that's who. Trading is an auction & with all auctions, people bid to what they "believe" the company is worth & not what the company is "actually" worth, that's left up to the fundamental traders to work out.

Example
Monday, 25th January the opening price of ANZ was $24.68 - closing on Friday 29th January 2021 was $23.71 (the price collapsed because of the emotion of fear)
Monday, 25th January the opening price of CBA was $85.11 - closing on Friday 29th January 2021 was 83.51 (the price shifted down because of the emotion of fear)
Monday, 25th January the opening price of BHP was $46.45 - closing on Friday 29th January 2021 was $43.56 (the price always shifts because of emotions)

Emotions
I recently made a post about "imagining emotions" & if you could handle daily or weekly trading. If you are highly strung & let your emotions get the better of you it's better for you to trade daily as your emotional curve is smoother over a shorter period. But if you can accept my last few posts on trading systematically, just go with the flow, take your punches & keep trading.

Skate.
 
Dear Mr Skate, when this happens, i then go a step further: why?
Backtest vs real should match but for known cases: missed buy,missed sell or obliged to sell at market after the open,and human error like typos etc
When they do not match after these corrections, it usually means you are looking forward in the code or similar and the explore results change with time
I do not sleep well with live systems which do not match their backtests after correction for known factors

QF, I'm guessing if Skate ran a backtest from early Oct 2020 to now, then showed the monthly performance for Oct, Nov, Dec and Jan they would be much closer to the actual performance. The monthly backtest figures shown were from 1st month to end of each month individually, if I'm not mistaken.
 
There was the whole "Gamestock" thing this week too which may have spooked many people. Mr Musk seems to be replacing Donald as the new star Tweeter!


It doesn't worry me too much, but do wonder if the "shorting pirhanas" get bit better each year herding large groups of long investers into the nets, then gorging themselves in a short sharp frenzy of shorting profits from the panic to exit. In the ever continuing arms race and after what we saw in Feb/March last year, their algos and software/hardware don't mess around on the odd strong down days.....
 
Top