
- Joined
- 28 December 2013
- Posts
- 6,401
- Reactions
- 24,351
As a chartist, yes, PRU is looking like it is ready to breakout and is screaming a buy. In the context of Action Strategy, in my opinion, the volatility seems to have died down and I see this as the reason for the sell signal. This is only my opinion and I am still on my training wheels.


Half the fun of trading is figuring out what others are doing & why
StaleStop = ROC(C,13)<0; C < MA(C,50);
@Lewie made a few points in his recent post giving me an opportunity "not to respond" but to make a few general comments as a system trader.
"I'm trying to invest on the basis of fundamentals"
1. What criteria should you use to pick a stock? Well, you can either use fundamental analysis (the study of balance sheets, PE ratio, P&L statements, also researching any known facts about the company & its managers, even the company’s historical performances) or you can use technical analysis (the study of charts)
2. I prefer technical analysis as I believe all that is known about a company, has already been factored into the share price already.
Skate.
Interesting, i had the same opinion of CZZ and a not so healthy debate with monsieur VC years ago : I view them as fraud in the penal way: these guys should have landed in jailextended discussion with Mr VC here: https://www.aussiestockforums.com/threads/the-education-of-an-investor.34402/page-9 on CZZ, which in my analysis was a fraud, but, like Enron, rose magnificently higher in price until it was taken private. Which was pretty lucky, as the fraud was starting to slip out.
LBO ? LBW I understand... howzat!plan on LBO transactions,
Half the fun of trading is figuring out what others are doing & why
When information is supplied it helps you become a detective that adds value to your learning experience. I could go into depth & explain why each position is being sold in the Action Strategy this week but that's not the point.
Clear as mud
Looking at the charts some positions will be obvious why they are being sold, where other positions will be a little more obscure. All chartists make up stories (in their head) about what they see in the charts & then go on to believe the story because of their ingrained bias. Biases are mental blind spots, it takes special effort to avoid falling into their traps. Often, we realize our errors after the fact & usually it's too late.
Let's not leave out the members who like to look at charts
The "Charts" always tell a story even if at first it appears that they don't. As traders, we are always playing catch-up with new information. As systematic trend traders, we are searching for the probability of what will happen next, sometime in the future. Punting on those probabilities can be hazardous to your wealth & emotions. The times when you get it right, can compensate you for the cost of constantly having a go.
Do the charts tell a story for you?
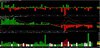
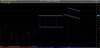
The red & green lines are the support & resistance lines for the 10 & 50 weekly periods.
Looking at the chart of [BUB]
It should be oblivious why it's being cut from the team.
Now let's look at these charts
What do you see?
What is the story?
Why are the positions being sold?
PRU - Perseus Mining
REX - Regional Express
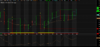
Looking at the chart of [BFG] it looks so good !!
Why is it being cut from the team?
BFG - Bell Financial Group Limited Ordinary
Hopefully
Some members may like to "express their opinion" on the charts above or why the positions below in the list are being axed from the team.
It pays to remember
There is no "right or wrong" answers in the "Dump it here" thread but a variety of opinions, one very good opinion has already expressed by @martyjames
Skate.

Oh, and if you're interested BFG is a 1st green bar CAM buy with above average volume.
View attachment 105618
One system's SELL can be another's BUY.
Some more thoughts on the "exit puzzle" for these stocks....
Theory 1. All 4 reaching previous price action (e.g. nodes on Volume Profile - or price where large volume has previous transacted, before have to break out to new high)
Theory 2: ROC of ROC is slowing (deceleration of price)? Seem to recall you saying before Skate you look at ROC of price as well as acceleration for entry/exit filters.
 _SECTION_BEGIN("SROC");
P = ParamField( "Price field" );
periods = Param("Periods", 15, 1, 200, 1 );
Plot( EMA(ROC( P, periods),20), _DEFAULT_NAME(), ParamColor( "Color", colorCycle ), ParamStyle("Style")  );
_SECTION_END();
There has been so much posted on the Action Strategy I am thinking I need to go back in time and re-read Skate’s posts. Before doing so @Skate are you able to tell us the Stop loss levels that you are using and also what stale stop parameters are used?
very good and a bit scary as last week is the first week the sum of my systems posted a loss..not gone that way for a long while.even my pure volatility one while going as planned overall did not do much@CNHTractor, I've been out & just noticed your post. I have been watching the interaction & discussions about the list of sell positions of the Action Strategy this week. They are all fair comments & some are very good. All the recent posts about the Action Strategy, by the way, show a level of interest. When I get some free time this afternoon I'll make a post that some may find interesting as it's something new & a bit out there. The problem will be to explain it "succinctly without being boring".
Backgrounding
I need to set the background. Some might have missed the turn in sentiment this week. Volume, Volatility & other metrics compared to the previous 16 weeks "things have changed". The last week & a half has been the turning point. What worked back weeks ago won't work going forward (the markets have changed).
Read a few of Duc's post & read the moderation of his words
@ducati916 knows the shift has been on for a few weeks now & his projections are solid (his posts align with a few of my technical indicators). The shift is not like a light switch (on or off) but more like a dimmer switch & it's turning clockwise, the room is getting brighter.
Different markets require a different strategy
Here is a thought, what if we can switch the strategy to take advantage of a changing market. That's a unique feature of the Action Strategy, it can gauge sentiment & "dance to the music being played".
More to come.
Skate.

The [if] keyword executes [statement 1] if the expression is true (nonzero) - [if else] is present & the expression is false (zero), it executes [statement 2]. After executing [statement 1] or [statement 2], control passes to the next statement. Also have a read here: https://www.amibroker.com/guide/a_keywords.html for a clearer picture of [keywords]never too proud to get my head around some new element of trading that might one day translate into an improvement.

One point which puzzles me a bit Mr @Skate, you mentioned Wednesday..and i remember reading your posts last week and thinking What? We are not at week's end. Do you also track daily moves?
We were just discussing the pro and con of daily vs weekly.
That's 2 of us..I do the same but did not expect you to: i imagined you as detached by wisdom and experience of the day to day fluctuation, floating above peons like meI update the progress of every strategy at the end of every day, meaning I’m across every Strategy. I’m a facts & figures man & I’m crunching numbers all day


We use cookies and similar technologies for the following purposes:
Do you accept cookies and these technologies?
We use cookies and similar technologies for the following purposes:
Do you accept cookies and these technologies?