
- Joined
- 17 October 2012
- Posts
- 707
- Reactions
- 1,389
I fully understand your view and am MUCH more comfortable trading a weekly system.One point which is system based and can swing me one way is the ramp -up speed:
if a weekly system increases exposure by 2 or 3 net positions a week.[.was the case for one of my earlier attempt], it takes 2 months to be fully exposed, during that time, the money/soldiers are not working ;-) and the peak trend benefit bypassed..first half 2019....
On the other end , if the exposure is quickly achieved, this does not matter anymore and weekly is much easier on mind/wallet.
It is clear you have a very good position scoring which allow you to sort the good from the bad of prolific selection..I have no such luck/expertise..maybe my efforts should go in a more open buy selection, with emphasis on the position scoring..that should allow me back in weekly.
We are always slave of our past experiences in today's decisions
")

It looks like a speeding Ducati...Not sure if the Action Strategy is a school of angry piranha or just a speeding Ducati??


Nice work Skate. Are these sells 'inactivity' mainly ?
Sounds like skate's broadly doing what I do - buy a whole bunch and then torch the non-performers.


Hmmm.. BFG in particular looks very strong.
Before we exit we need a few confirmations
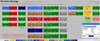
For the Action Strategy to exit a position we need a few confirmations that the momentum has slowed, stopped or reversed. The "exit confirmation" guarantees you will give back a proportion of your open profits. The exit strategy in our trading strategy uses a GTFO filter as well as three independent exit indicators being: (1) Variable Trailing Stop, (2) StaleStop & (3) Volatility Dependant Stop which is clever in design. The exit is the heart of the strategy trading such small positions driven by "volatility measures" taken from "other sources". All positions need to meet the conditions of our trading plan or they face the humiliation of being dropped from the team no matter how they are currently performing or how we think those positions will perform in the future.
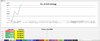
Do the charts tell a story for you?
The red & green lines are the support & resistance lines for the 10 & 50 weekly periods.

Noted!It is not the GTFO filter as this would mandate an exit from all positions.

My idea was to invest in a wide range of businesses that I have some degree of knowledge about, so I'm trying to invest on the basis of fundamentals as opposed to speculation. As such my first "filter" was going to be an intrinsic value calculation, the more mainstream of them (using average growth rate to extrapolate the free cash flow, discounting that and dividing by shares outstanding to get the intrinsic value per share) I thought that the free cash flow extrapolation method of calculating intrinsic value would be quite a strong tell of a companies health? Since it essentially represents profitability, so I guess one question is: Is it common to get extremely differing results in these calculations
As a chartist, yes, PRU is looking like it is ready to breakout and is screaming a buy.interested by PRU:
looking at the chart, this is what I see:
It is going to bounce and break that level (it tried to cross 3 times )next week
BUY BUY BUY ;-)
We use cookies and similar technologies for the following purposes:
Do you accept cookies and these technologies?
We use cookies and similar technologies for the following purposes:
Do you accept cookies and these technologies?
