Australian (ASX) Stock Market Forum

December 2024 DDD

Oil News:

Slower and shallower were the two key takeaways for the Federal Reserve's 2025 rate policy outlook, with a suggested prolonged pause in rate-cutting next year adding insult to the oil market’s injury. China remains a bearish factor for oil with almost all 2025 outlooks trying to outcompete one another in terms of bearishness, all this leading to a dip in Brent prices to $72 per barrel again.

Chinese More Bearish on China. China’s state refining giant Sinopec (SHA: 600028) expects the country’s oil consumption to peak by 2027 at 16 million b/d, with growth only coming from the petrochemicals sector as both gasoline and diesel are expected to fall next year, by 2.4% and 5.5%.

Oil Majors Swap Assets in Australia. US oil major Chevron (NYSE:CVX) announced it would sell its interest in the North West Shelf venture it co-operates with Australia’s Woodside (ASX:WDS) in return for the latter’s 13% stake in the $34 billion Wheatstone LNG project and an associated field.

US Arbitrage to Europe Narrows. The spread between WTI and Brent futures narrowed to $3.40 per barrel this week, the smallest reading since October 2023 as tight crude inventories in the United States strengthened the US benchmark, restricting US oil exports after record volumes to NW Europe last month.

Brazil Sweetens Upstream Offering of 2025. As Brazil prepares to hold its next upstream licensing round in the first half of 2025, its Energy Ministry announced it would add 393 new oil exploration blocks and 5 discovered fields to its permanent offer portfolio, mostly offshore blocks in the Santos basin.

Iron Ore Set to Fall Through Key Barrier. Disappointed by the lack of improvements in China’s economy and the Australian government’s highly bearish forecast that sees iron ore averaging $80 per metric tonne in 2025, the metal posted four consecutive days of declines and dropped toward $101/mt.

Oil Major Clinches Iraq Megadeal. UK oil major BP (NYSE:BP) agreed on technical terms with the government of Iraq to revive one of the largest oil fields in the country, Kirkuk, a decade after it was ravaged by the Islamic State, marking a return of BP to the field that it initially discovered in 1927.

King Coal Surprises Everyone, Again. The International Energy Agency has revamped its coal demand forecast again, expecting global consumption for coal to hit new records every year through at least 2027, increasing to nearly 8.9 billion tonnes by 2027 largely thanks to India and China.

US Graphite Producers Demand Massive Tariffs. US producers of graphite have filed petitions with two federal agencies this week, asking for investigations on potential Chinese violations of anti-dumping laws and demanding that the White House slap a punitive 920% tariff on China-produced graphite.
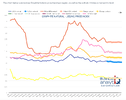
US EPA Approves California’s Fossil Car Ban. The US Environmental Protection Agency approved California’s landmark plan to ban gasoline-only vehicles by 2035, as the automotive industry expects President-elect Trump to rescind federal mandates on EV sales and tighter vehicle emission standards.

Cocoa Futures Soar to Record Highs. Almost tripling over the course of 2024, cocoa futures rose to an all-time high of $12,636 per metric tonne this week as the Ivory Coast’s harvest outlook once again downgraded to 1.9 million tonnes, almost 15% lower than the government’s own forecast.

UAE Woos Drillers to Form JV. ADNOC Drilling, the upstream unit of the UAE’s state oil firm ADNOC, has formed Turnwell Industries, a joint venture with oilfield service majors SLB (NYSE:SLB) and Patterson-UTI (NASDAQ:pTEN), seeking to tap into the country’s 220 billion barrels of unconventional oil.

Trump Threatens Europe to Buy More US Oil. US President-elect Donald Trump said that the EU could face tariffs if the regional bloc does not shrink its widening trade deficit with the United States by purchasing more US oil and gas, extending the tariff threat beyond China, Canada and Mexico.

Venezuela Resumes Swap Deals with India. India’s largest private refiner Reliance has resumed an oil swap deal with Venezuela’s PDVSA, sending a 500,000-barrel cargo of heavy naphtha in return for a VLCC laden with heavy Venezuelan Merey after the transaction was greenlighted by the White House.

Screen Shot 2024-12-21 at 6.25.37 AM.png

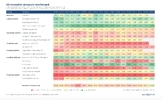
This updated US recession dashboard revisits several macroeconomic and market indicators, including nonfarm payrolls, unemployment rate, credit growth, residential construction, new manufacturing orders, truck sales, 10-year-3-month term spread and corporate earnings growth. These indicators are heat-mapped using historical Z-scores and combined into a composite recession score to reflect conditions and expectations for economic contraction.

When this chart was first published on 26 January 2024, recession pressure had reached elevated levels, with the composite score peaking at more than 84% in October 2023. At that time, slowing loan growth, weakness in leading economic indices and the inverted government bond yield curve signaled significant caution, despite a resilient job market.

Since then, the picture has improved slightly. Recession pressure moderated in recent months, even plunging to 27% in November 2024. The labor market remains strong, while some leading indicators, such as new manufacturing orders, are showing tentative stabilization. However, loan growth remains soft, and the term spread remained inverted although towards uninversion, maintaining a degree of uncertainty.

While hopes of avoiding a recession have strengthened since January, risks persist. Vigilance remains essential as mixed signals across key indicators suggest caution in economic and investment decisions.

Screen Shot 2024-12-21 at 6.28.39 AM.png

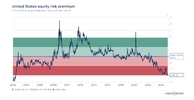
This chart tracks the US equity risk premium (ERP), a simplified measure calculated by subtracting the 10-year Treasury yield from the equity earnings yield. The chart shows how the gap between equity and bond returns has narrowed over time. Positive values indicate that stocks are delivering higher returns relative to bonds, while negative values—as seen recently—mean bonds are outperforming equities. In this updated version, the ERP dipped below zero for the first time since 2002.

When this chart was first published on 16 February 2024, the US ERP was already hovering near historic lows, with stocks offering only marginally higher returns than bonds – far below historical norms.

Since then, bond yields have continued to climb, keeping pressure on equity valuations and compressing the premium further. A brief upswing occurred during summer-to-autumn months, largely fueled by Nvidia's sharp rally and the tech sector’s strength. But this momentum was short-lived. Recent developments, including the aftermath of election results, reversed these gains and pushed the ERP into negative territory.

The updated chart underscores the shifting balance between equities and bonds, a reminder of the critical role that interest rates play in portfolio allocation decisions.

So liquidity got added:

Screen Shot 2024-12-21 at 6.30.47 AM.png
Screen Shot 2024-12-21 at 6.31.11 AM.png

Screen Shot 2024-12-21 at 6.39.02 AM.png

With the added liquidity came a respite in selling stocks as buyers stepped in.

Is it new buyers long or rather short sellers buying to cover? Really difficult to tell. But without the FX and Bond markets getting supplied with that extra liquidity, today could have been pretty ugly.

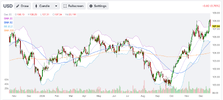
That being said: the Fed (who else) cannot do more (at the moment) than add some liquidity. If real buyers do not step back in, there can still be a lot of pain to come. With the Fed signalling 'no more cuts' the USD could well resume its current move higher.

Screen Shot 2024-12-21 at 6.24.49 AM.pngScreen Shot 2024-12-21 at 6.24.59 AM.png

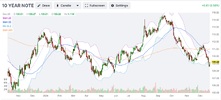
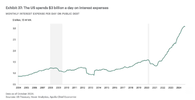
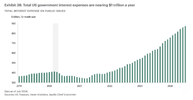
Paradoxically higher interest payments are one of the drivers of a STRONGER USD. With $7 Trillion to rollover in 2025 that trend will move higher as the debt will be higher priced.

Screen Shot 2024-12-21 at 6.23.53 AM.png

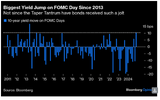
Bond market knows.

Screen Shot 2024-12-21 at 6.32.09 AM.png

Today the band-aid is on. For how long?

So looking at these 3 charts:

Screen Shot 2024-12-21 at 6.51.50 AM.pngScreen Shot 2024-12-21 at 6.51.25 AM.pngScreen Shot 2024-12-21 at 6.51.10 AM.png

All in?

No, but some of these, foreign allocations, can reverse pretty fast (and will in a strong USD environment).

The passive flows (ETF investing from wage deductions into 401K) are massive and will just continue to continue mindlessly until they don't.

This is the push-pull: foreign DI and home based passive flows. Both are currently buyers. One could reverse pretty fast.

jog on
duc
 
US Graphite Producers Demand Massive Tariffs. US producers of graphite have filed petitions with two federal agencies this week, asking for investigations on potential Chinese violations of anti-dumping laws and demanding that the White House slap a punitive 920% tariff on China-produced graphite.

920% tariff? Yikes. What's the second, third order effects of this? Is it going to change the price of graphite world wide, or just encourage US and other western companies to hop to it with graphite mine delivery.

Screenshot 2024-12-21 at 09.49.29.png
 
Thank you @ducati916 for your DDD contributions throughout the year. I enjoy reading them even if I don't understand the underlying macro-economics of most of them. The maths behind the MSTR accumulation of BTC went over my head by 10,000 ft. MSTR was easy to trade earlier in the year but it's now becoming too volatile. I agree that there's going to be a disastrous implosion with this. Don't know how and don't know when.

I keep an eye on the oil, gold and USD news as they pertain to my positions. Thanks for those.

I do miss my daily dose of Fly. Amongst all the emotional outbursts there was wit and humour along with a stock tip or two. He frequently brought stocks to my attention that I'd not seen.

I'll be doing a lot more trading in the US market next year. I don't expect the US to have another year of rising prices like this year but there's just so many more trading opportunities than in the ASX.

Reports from NZ say that you're doing it tough with the high costs of living. Much worse than Aust and so bad, that many are crossing the ditch. I trust that a person of your talent should be OK and enjoy a festive holiday period.


Peter,

Thanks for the acknowledgement, always nice to feel the love.

Yes it's a shame Mr fff decided to go private. As he lives in America (Sth Carolina) his observations were often insightful, never mind the irreverence, humour and as you say, off the beaten track stock ideas.

Apart from the time difference, why would anyone not trade the US? So many more varied strategies and instruments are available.
It would be nice to actually have a 2-way market. That however will be resisted by the powers-that-be for tax revenue purposes.

I'm in a pretty recession proof industry. Although with the increasing roll-out of AI, even my industry may feel the pinch down the road a little.

For next week:

Screen Shot 2024-12-21 at 7.01.16 PM.pngScreen Shot 2024-12-21 at 7.02.13 PM.pngScreen Shot 2024-12-21 at 7.02.45 PM.pngScreen Shot 2024-12-21 at 7.04.14 PM.png

The week that has just been:

Screen Shot 2024-12-21 at 6.36.38 PM.pngScreen Shot 2024-12-21 at 6.37.00 PM.pngScreen Shot 2024-12-21 at 6.38.00 PM.pngScreen Shot 2024-12-21 at 7.06.26 PM.png

So obviously not a 'month' but with two short weeks, December has so far been a disappointment for the bulls.

Valuations at the 'top' of markets are not a great timing tool. But what they do tell you is that markets do not shrug off bad news. So with the Fed losing control of inflation again...and it will get worse, kiss your rate cuts (for the moment) goodbye, that rollover of $7 Trillion in debt will REALLY pressure deficits.

The Bond market is telling you already that it is choking on paper. There is NO WAY without a major buyer (the Fed) that the credit markets can absorb and digest $7 Trillion. If the Fed is the buyer (and they will be) inflation is off to the races.

A falling stock market = falling tax revenues = increased deficits = Fed buying even more paper.

Long story short: this market is a bomb just waiting to explode. Unlike 2020, you can't buy this dip.
jog on
duc
 
Unlike 2020, you can't buy this dip.
sadly i think you are correct

maybe the odd cherry-pick , but i strongly suspect winners will be picked ( serial money-pits saved , companies like Boeing )

but will it happen before Trump can get sworn in ?

or will something like a MAJOR war supply the distraction/breathing-space needed to paper over this mess


Mr Saylor pumping btc.

With MSTR being added to QQQ

Screen Shot 2024-12-22 at 7.27.21 AM.png

So foreign FDI = $16 Trillion

Screen Shot 2024-12-22 at 7.27.33 AM.png

Foreign FDI (largely) flows into QQQ

Screen Shot 2024-12-22 at 7.27.44 AM.png

And US inverted NIIP.

So MSTR stock will become added to the foreign FDI, internal passive flows and any added weighting that Fund managers add to MSTR.

Mr Saylor (and his copycats) will continue to sell equity and convertible bonds and buy btc.

But:

We have seen that btc will follow QQQ on upside and downside already. This trend will be magnified by MSTR inclusion into QQQ. If the trend reverses, the leverage now acts in a very negative manner and will force liquidations of btc. Mr Saylor and MSTR have been buying btc at these $90,000 levels with increasing levels of debt and equity.

jog on
duc
 
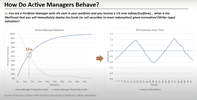
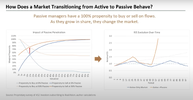
The effect of passive flows:

Screen Shot 2024-12-22 at 6.36.58 PM.pngScreen Shot 2024-12-22 at 6.38.17 PM.png

So essentially chart 1 maps information flow linked to valuations.

Chart 2 states: markets operate on 'efficient market' theory, prices are going up, keep buying.

You would have thought that EMT had died a death decades ago. Clearly not. The result is that the markets are moving higher in ever narrower confines (US markets are outperforming all other global markets) and becoming more and more overvalued because value is not even a thing.

This ties in perfectly with the US NIIP position of FDI.

If (when) this goes into reverse, watch out. That is $16 Trillion in FDI in stocks that can reverse. So when pundits talk about 50%, 70% and 80% retracements, this is how it happens.

What is the catalyst? The trigger?

A too strong USD.

jog on
duc
 
Top