Australian (ASX) Stock Market Forum

Bitcoin price discussion and analysis

Why you shouldn’t sell.
  1. Many are pretty incapable of removing emotions from their financial decisions. The more emotionally attached you are to an investment, the more likely you are to make a mistake with it
  2. Holding your asset costs $0 (generally speaking) and you can short (hedge) when you feel uneasy. Not only is this peace of mind it’s also a non-taxable event (holding)
  3. Borrowing against bitcoin will soon become more user friendly. Money is cheap, bitcoin will thrive for many more years. Once it becomes a less volatile asset more will jump on-board
There's always two sides of the coin, ( bad pun)
Depends on view
Long term investment
Or short term investment
On the short term time frame btc is resembling 2017.
The volatility alone of swings of 10% in a 8hr time frame give you a indication that we are topping,
Personally the Crypto space is @ its infancy stage like google / or amazon was 20years ago.
Tho that being said I'm personally @ 80% in cash atm and will be rebuying heavy in the long term once the markets look to have made a correction.
Atm for me personally i think all markets are set to tank in 2-3 months ( this is my view)

I guess my trading has two strategies , I have long term investment accounts,And some accounts dedicated to day trading
As attached my every day trading account / trades done in 1 month timeframe.
Pls DYOR
 

Attachments

  • 20210325_225400.jpg
    20210325_225400.jpg
    128.4 KB · Views: 40
Last edited:
Havent posted here since JAN and boy the last few months have been great thats for sure.

Any thoughts on if/when we will hit 100k AUD?

I still have 17/18 in the back of my mind, might be time to start taking profits soon.. or DCA out some profit anyway at worse.
 
So BTC cratering over the weekend, now down 23% from ATH.
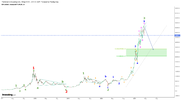
Looking at the recent pattern of trend this was no surprise. A three drives to a top pattern and a wedge type ending diagonal pattern. Very bearish
 
Looks to be a textbook EW impulse pattern completion. If count is correct we might be in the early stages of a pullback under 35K or the span of the previous wave 4 (blue) of one less degree.
More importantly this might also be a warning for an imminent stock market correction as BTC movements have been preceding indices of late. Ending diagonal pattern that developed last few weeks suggested imminent pullback ahead


ui6hh.png
 
Worries that arrived on the scene a few weeks back have meant that enthusiasm for Bitcoin miners has reduced and RIOT is now at just above $42 at the close of 1 am BST Saturday morning, down 36$ from the $78 high point or 46%.

Concerns still are that the USA government will take moves to curb Bitcoin. The International Monetary Fund has raised concerns for a while now. Some talks with China this weekend and possible more conciliatory terms may help take the pressure off the known situation where China is the biggest miner of Bitcoin and Russia is expanding fast.

Russian Oil Drilling Giant Opens a Crypto Mining Farm Run on Gas Energy
Https://www.ogv.energy/news-item/russian-oil-drilling-giant-opens-a-crypto-mining-farm-run-on-gas-energy#:~:text=Gazpromneft%2C%20the%20oil%20subsidiary%20of,BTC%2C%20%2B4.46%25)%20mining.

Bitcoin mining: China clamps down on booming trade where some can earn £60,000 a day
Https://news.sky.com/story/china-clamps-down-on-bitcoin-mining-where-some-can-earn-60-000-a-day-12267572
 
Looks to be a textbook EW impulse pattern completion. If count is correct we might be in the early stages of a pullback under 35K or the span of the previous wave 4 (blue) of one less degree.
More importantly this might also be a warning for an imminent stock market correction as BTC movements have been preceding indices of late. Ending diagonal pattern that developed last few weeks suggested imminent pullback ahead


View attachment 122961
Hard to know exactly of the pullback , but on the daily chart it hasn't broken the trend line ,
I'm still bullish on crypto atm , a healthy correction,
For me personally i bought up generally more ada / xrp / vet ,
Altho your analysis has merit I still think we are a few months away from the top,
Cheap money / u.s.d looks weak ppl hedging btc over u.s.d
Investment will still be put in stock markets / commodities and crypto markets at the moment .

Analysis does not imply "ultimate top" in this market. But dip buyers will need to have long pockets and a lot of patience. BTC has already seen the best of it's gains in terms of momentum. That pattern that just completed is evidence of that.
Personally I am a short term player and sold. I think it's headed lower i
n the weeks ahead. Will sell the rallies on downside continuation signals
 
Last edited:
dip buyers will need to have long pockets and a lot of patience

I got a message from one of the exchanges yesterday that all the deposits into exchanges are being delayed by hours because there was a big influx of money due to the "volatile market" so buying the dip. Looks like there is still some steam
 
Think again....

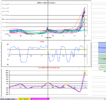
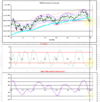
There is not just a completed impulse wave. EW used in isolation is not enough. The attached cycles chart adds more weight to the bearish case. Firstly the Curvilinear Envelopes. Price action pierced the 86 bar cycle upper band (upper pink line)on the weekly close. When a throw over of the 3 sigma line occurs ( as it has in this case) it suggest price has moved too far too fast and a reversion to the opposite 32 bar cycle lower band is high probabilty. This lines up with the span of the previous wave four of one less degree between 34419 and 41627.

Also the FT Swing slow ( blue line second pane) has issued a sell signal, same with the Cycle Differnetial 3rd lower pane. It's only the first day of the week so I shouldn't say the sell signal is a given, but assuming it finishes lower at the end of the week then it's valid.
It should be noted if this is the case, this will not be a short term decline, more like multi week/month. So for the moment see no reason to close shorts or look to buy dips.2021_04_19_21_06_21_Window.png
 
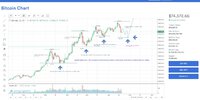
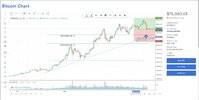
This current 20% correction of btc may form the second leg down with in 5-8 day time frame which will correlate to the past three previous 2nd leg downs as attached on chart, then continuing to test new highs.
I wont be trading against trend on the current bull run until i see more evidence.
Quite simply put , trade with trend, With cheap money printing / low interest rates , I will ride with crypto /digital currencies /stock and commodities .
Trade with a plan , trade with stop loss ,
This is not financial advice pls DYOR
 

Attachments

  • SharedScreenshot btc 1.jpg
    SharedScreenshot btc 1.jpg
    130.7 KB · Views: 17
  • SharedScreenshot btc.jpg
    SharedScreenshot btc.jpg
    123.8 KB · Views: 14
This is a short term chart of BTCUSD 3h. The longer term chart (weekly) was presented a few posts ago and still remains bearish pending where it finishes end of week.
For now price has moved too far and too fast away from the nominal and a reversion or bounce should take place. Price has thrown under the pink 86 bar cycle band. As such a reversion to opposite upper 32 bar band is a high probability between 58326 to 60k. I suspect at that point it will be in position to be forming a longer term head and shoulders pattern to add to shorts before continuing lower.

2021_04_20_22_02_23_Microsoft_Excel_SwingBandsCycle_2021_Offset_CD_6Final.png
 
Top