- Joined
- 12 May 2008
- Posts
- 499
- Reactions
- 7
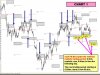
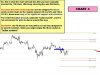
Some people swear by the validity and robustness of Fibonacci numbers as a support & resistance trading tool.
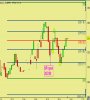
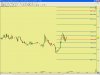
Below is an example using a FTSE futures 10min chart, from yesterday 20/2/09.
The yellow circle is the starting point (zero; green line 3947 on chart 1.) for setting the fib retracements for the start of the trading day.
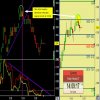
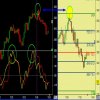
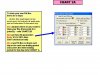
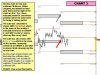
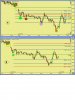
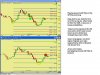
At each “significant” lower pivot (see coloured circles) the green “zero” line from the start of the day on chart 1., has been moved to that pivot point deemed significant. Ie., green line moved to green circle (chart 2), then to red circle (chart 3), and so on. All the retracements (S&R) move in synch when the green zero line is moved.
(** what is and isn’t a significant pivot only becomes obvious in real time after some time has elapsed, or the next S or R has been broken, . . . . other ways to calculate???).
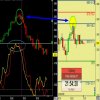
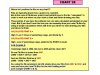
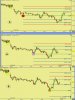
The charts, from a basic visual inspection, show the fibs to have some validity.
How to filter out the breaks and translate the fibs into a trade plan, . . . . I’m not sure yet.
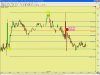
In sum, I’ve only just started exploring fibs, so I’m not advocating for or against.
What do you think about fib numbers as a trading tool??
Below is an example using a FTSE futures 10min chart, from yesterday 20/2/09.
The yellow circle is the starting point (zero; green line 3947 on chart 1.) for setting the fib retracements for the start of the trading day.
At each “significant” lower pivot (see coloured circles) the green “zero” line from the start of the day on chart 1., has been moved to that pivot point deemed significant. Ie., green line moved to green circle (chart 2), then to red circle (chart 3), and so on. All the retracements (S&R) move in synch when the green zero line is moved.
(** what is and isn’t a significant pivot only becomes obvious in real time after some time has elapsed, or the next S or R has been broken, . . . . other ways to calculate???).
The charts, from a basic visual inspection, show the fibs to have some validity.
How to filter out the breaks and translate the fibs into a trade plan, . . . . I’m not sure yet.
In sum, I’ve only just started exploring fibs, so I’m not advocating for or against.
What do you think about fib numbers as a trading tool??
")