You are using an out of date browser. It may not display this or other websites correctly.
You should upgrade or use an alternative browser.
You should upgrade or use an alternative browser.
XJO triple tops
- Thread starter kohnicky
- Start date
-
- Tags
- triple top xjo
- Joined
- 3 March 2007
- Posts
- 574
- Reactions
- 1
Re: XJO tripple tops.
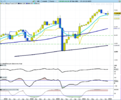
From my graph its not a triple top, we've tested the 6400 mark many times, its just resistance thats correlating with the DJIA on-route to test resistance at 14,000.
XJO making any top is irrelevant, if the Dow breaks 14,000 we'll break past too.
(ps my graph is out of date - our market hit around 6400 today)
Attachments
- Joined
- 3 March 2007
- Posts
- 574
- Reactions
- 1
Thanks for your opinion Vishalt,
But how about the rest of our bankers?
Will weaker USD value actually have negative effect on our market?
A lot of our miners profits are denominated in USD (for reasons beyond my understanding), and apparently each cent increase slashes $60m from their bottom line which is a fairly scary thought.
But for our retail stocks its good news, so I dunno how it'll work out, I hope our miners change the way their profits are denominated!
Weekly Wrap, Week ended 17/12/21. XJO rises from crucial levelHi all,
Looks to me that XJO, CBA, ANZ, WBC has either double/tripple top.
And XJO MACD, RSI all looks extremely bearish to me.
Would love to hear any opinion from anyone in this forum.
Kind regards,
Nicky.
XJO Monthly Chart:
XJO peaked in August, 2021. It has since fallen September-November, but is now resuming its bullish trend in December. This is important as it is moving up from a crucial long-term level - the 8-Month Exponential Moving Average. December tends to be a seasonally bullish month for the market, so we may see more upside. See full Weekly Report at my Blog
Attachments
- Joined
- 10 June 2007
- Posts
- 4,045
- Reactions
- 1,404
all depends on the phase you interpret youre in, your execution time frameWeekly Wrap, Week ended 17/12/21. XJO rises from crucial level
XJO Monthly Chart:
XJO peaked in August, 2021. It has since fallen September-November, but is now resuming its bullish trend in December. This is important as it is moving up from a crucial long-term level - the 8-Month Exponential Moving Average. December tends to be a seasonally bullish month for the market, so we may see more upside. See full Weekly Report at my Blog
the wider the time frame the larger the context, whether you entered pre december or exited post jan
..the phase of the trend matters regardless of trend bias, strong trend bias is rare as it transpires so quickly in a small % of overall
trend phase
most recent https://www.tradingview.com/x/fSjKpk4c/
looking further back https://www.tradingview.com/x/NmU66o7S/
red boxes denote post jan declines, blue boxes H/H's post jan
current pos on xjo

for mine, pros are allowing trends to pull back as they look for better value, holiday periods make ideal culling, that is marking prices down as opposed to a trend reversal, only near the bottom should we see conviction that we are in something more than that
fwiw, triple tops are nonsense !
Similar threads
- Replies
- 75
- Views
- 9K
- Replies
- 24
- Views
- 10K
- Replies
- 14
- Views
- 7K


