
CanOz
Home runs feel good, but base hits pay bills!
- Joined
- 11 July 2006
- Posts
- 11,543
- Reactions
- 519
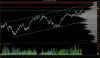
I was just wanting to see what it looked like when the volume-at-price is set per month, for example. Zoomed in to the last year or so.
First the SPI.
SPI200 (XJO Futures)
I have highlighted the main value area. I suspect we'll run-out of steam soon at the 5384-5403 area. If we do not find sellers there, then i would target 5440 for sellers. If we can consolidate at 5440, this would be a very positive sign for a move higher....However if this area gets firmly rejected, along with 5400, then we could be headed to the lower side of the value area, 3500. We should be able to see this play out in the next few weeks because we are relatively close to those levels now.
My view from the Technical side is that in both price/percentage and time the market has not come back far enough in my opinion.
I believe we are in a C wave and from this perspective am expecting the market to still come back towards 4500 towards the end of the year.
Although I must say that it has been holding up well around the 5000 level on any pullback.
View attachment 66518
Looks like some of the levels you discussed here might come into play. Does the small pull back & Recovery since this post change anything in your reading of things?

She don't come round that often and she's typically late but I think the old Cow might be onto the scent of a Bull.
View attachment 66864
Egad! Is that an indicator (Coppock) on that graph? I'd be curious how many indicators you've kept in your normally FA/value orientated world craft?
I am interested to hear your reasons for being bullish on the market Craft.
Yep its the Cow-poke (Coppock). I'm afraid that pretty much exhausts my arsenal of indicators. Although I do keep a reasonably close eye on market breadth and occasionally I might pull up a momentum oscillators (don't care which one) to check for divergence. But largely my charting package is wasted on me these days except I do like to look at just the plain charts (Full history in Equicandle format) of the stocks I'm interested in. A picture paints a thousand words.
I did not realise you were closet technician
The daily Coppock for S&P 500 crossed below zero in March this year for the first time in over 6 years. The weekly Coppock for S&P 500 turned down in December last year for the first time in over 7 years. There is divergence in price and Coppock weekly. Just noting because if U.S. goes down we follow to a lesser or greater extent. Terrible lag. :frown:She don't come round that often and she's typically late but I think the old Cow might be onto the scent of a Bull.
Oh dear you have found me out - yes I like to look at naked charts, sometimes I even run scans on price data Oh, I feel so dirty.I did not realise you were closet technician
No one has ever called me smart before, well not without adding another for letters, you'll make me blush.He's just a smart guy, one of the gems on ASF.
The daily Coppock for S&P 500 crossed below zero in March this year for the first time in over 6 years. The weekly Coppock for S&P 500 turned down in December last year for the first time in over 7 years. There is divergence in price and Coppock weekly. Just noting because if U.S. goes down we follow to a lesser or greater extent. Terrible lag. :frown:
Oh dear you have found me out - yes I like to look at naked charts,

Thou durst not confess to tainted bloodlines lest thou be declared a mudblood by Lord ValdeHunt. At the peril of thy immortal soul, I beseech thee, shield the pedigree dream from the grievous bite of thy mongrel analyst reality lest thou shatter the faith of the reverent members of Trading House Sly There In!At first, I thought it read, "I like to look at charts naked"...which is probably taught in some obscure Gann course. Hey, whatever works!
Whilst it's confession time...I'll come clean, too. Whilst I have zero need to look at a chart as far as my plan goes, I still do it from time to time. I can't help myself. 90% of investors do it, I'm sure...and the other 10% are lying.
No one has ever called me smart before, well not without adding another for letters, you'll make me blush.
View attachment 65284
Nothing seems too disturbing here from a Big Picture Australian Valuation perspective.
Note how that chart starts in 1983. 1982 was the start of the greatest secular (i.e. long-term) bull market in stock market history. I bet if you used a 100 year chart it would not look so rosy. In the grand scheme of Thongs your sample size of data on that chart was both too small and represented an exceptionally bullish period of stock market history.
I have seen longer term CAPE charts and I can tell you its a somewhat different story.
We use cookies and similar technologies for the following purposes:
Do you accept cookies and these technologies?
We use cookies and similar technologies for the following purposes:
Do you accept cookies and these technologies?
