Australian (ASX) Stock Market Forum

What's an indicator for the average high and low of a certain period?

Hey Tech/a, I definitely believe you know what you're doing, but Im running into problems knowing how to implement it.
(The Tradingview help pages are pretty confusing, which is why I'm asking here instead)

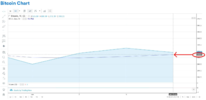
For the first step, do I use the moving average indicator and look at the last level at the very right of the chart, like this? (using a common, fairly simple symbol):

1622012473527.png

This chart is similar to the one Im using, and is easy for anyone to see:


Yet, is there a better charting app I can try to understand the basic principle more easily?
 
(post 2 of 2):

Hey over9k, what I want is:

1) For any period X (an hour, a day, a few days)...
2) The average of all the high prices on the chart
3) The average of all the low prices on the chart
4) Have lines showing each
so I can decide if there is enough of a spread for me to bother trading (ie. choosing a low price to buy at and a higher price to sell at, short-term)

that's a mean-reversion system, trading within a range. plenty of ways to try and play a MR system.
 
Hey Tech/a, I definitely believe you know what you're doing, but Im running into problems knowing how to implement it.
(The Tradingview help pages are pretty confusing, which is why I'm asking here instead)

For the first step, do I use the moving average indicator and look at the last level at the very right of the chart, like this? (using a common, fairly simple symbol):

View attachment 124910

This chart is similar to the one Im using, and is easy for anyone to see:


Yet, is there a better charting app I can try to understand the basic principle more easily?
Hi TiminOz,

For the first step, do I use the moving average indicator and look at the last level at the very right of the chart, like this? (using a common, fairly simple symbol):

Yes, that is correct, however, you will need to alter the parameter in this formula "MA (9, close, 0) " by changing close to high.
You will then need to create your second moving average using MA (9, low, 0).

Hope this helps,
Cheers Rob
 
Haha thanks Rob, ppl keep telling me awesome formulas but I have no idea how to enter them!

I'm using a chart similar to this one - how do I enter those formulae?

 
Top