Australian (ASX) Stock Market Forum

What's an indicator for the average high and low of a certain period?

Joined
11 January 2019
Posts
81
Reactions
19
Hey all !

I'm trading on the short-term price movements of a thing I own a large amount of, trading over a few hours...a day...a couple of days.

I'd like to find out an indicator (on Tradingview, ideally) that I can use to quickly get a sense of whether it's actually worth me taking more time to set a precise high (sell) price and low (buy) price for the next trade.

I believe I want something reflected in the following:

"Over X period, the average price ranged between Y (high price) and Z (low price)"

X would be something I would choose: an hour, up to a week (for example).

I just don't have the experience yet to see this visually and also it's good to avoid bias/wishful thinking.

Once I see these two prices, I can see whether the difference between them over period X is enough of a spread to justify me looking more closely.

(Obviously the smaller the number of shares/coins/whatever you are applying in each trade, the larger the spread has to be to make a 'profit'. If it's too small, it may not be worth looking further. Better to wait till the spread is larger.)

Can someone suggest the name of an indicator, ideally one that I can use easily on Tradingview?

Thanks so much for your help and apologies if this is in the wrong section or perceived as a dumb question.
 
Hey thanks Peter - that looks v cool !
I just tried that and it gave me a 'DC lower' and 'DC upper', so i assume that's the average of highs and lows...

How do I set the desired time-range? I noticed that the numbers dont seem to change much based on what time-range is in view...so there must be another way to set what period you want to look at. (For example i moved the graph to a period with very high highs and low lows and the numbers stayed the same)

Is 'DC Basis' the median or avg price or what is it?
 
Click on the settings icon, this will allow you to change the period.
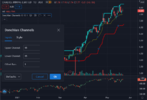
In my example the DC shows the highest and lowest values in the last 15 periods (days).

2305b.PNG

This indicator is the main indicator of the famous Turtle Traders trading plan. They bought break outs of the DC.
 
This is the built in scan for the Donchian Channel (Abbreviated as DC).

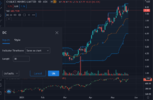
This chart allows the length to be changed and also allows the DC to be set on a specific time frame. This allows you to look at 1hr charts and show the DC on the daily time frame.

2305c.PNG

If we'd bought the 30 day break-outs in CHN, we'd be looking good.
 
You aren't necessarily going to have a range though, you've got trend(s) to contend with.

If you just want a basic momentum indicator, the MACD is your bet ;)
 
Post 1 of 2)
More refined info about what I am trying to do...


Hey all, thanks for all your help - I have to say, ASF has always been one of the friendliest, non-flamey truly helpful forums I've used.

It will take me a while to look into these indicators, however I did spend time already looking into the Donchian chains...

...and it turns out its not QUITE what I wanted, if getting there...

Thing is, Donchian is based on the HIGHEST price over the last X days.

Whereas I want the AVERAGE of highs and
AVERAGE of lows in the period...


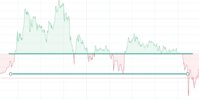
I thought I'd include a chart to show what I mean.

The main purpose is to work out what is a REASONABLY likely high and low price that will occur in the next few hours or day or so, based on the previous period of the same length.

Purpose: to see if its worth me examining further exact possible buy-sell sell-buy prices (ie if the spread of high and low is too small, with my avab stash, it may not be worth bothering further)

I attach my usual way of doing this, based on trying to find at least "safer" buy/sell prices.

You can see I've put a line across the level of high prices that seem to be pretty frequent. And the same with the low prices.

What I really want is something that does something like this, but only:
- quicker
- more precisely.

If I had a tool that could show me the AVERAGE of highs and the AVERAGE of lows over X period, that would be a starting point for creating a line like that. Then I might decide to be a bit more bold with a slightly higher sell price than average or a slightly lower buy price. But its a more precise, more objective starting point.

Any more refined ideas?

1621925133166.png
 
Post 2 of 2): Qs for Macca and Peter2

Macca, how do I do that?

It may also be of interest if you put a simple moving average of the high and the low of your chosen period on the chart.

I was wondering if your suggestion might help me achieve above...But any tips on how to do it in Tradingview? Where do I start? I have no idea right now how to choose TWO moving averages.

What app do you use?

Peter2: what app do you use?

That app looks like a more flexible one than Tradingview, at least the version Im using on my Exchange. What is it?


Exchanges - do APIs on them allow you to use the price data from them on your third party charting app?

I notice that my exchange has a section for an API. Is it likely that this API would allow me to connect a third party charting app to their price data? Or is that possible some other way?
Note: I'm not trading on something that's on a standard stock exchange, and different exchange apps have difference prices.
 
In tradingview, just use the following

Code:
emahigh = ema(high, 9)
emalow = ema(low, 9)

You could also use the ATR for the same period and use it along the lines of emahigh + ATR(9). Although, more conservative could be half of the ATR as an ATR does not dsicriminate in direction (its the difference between the high's/low's).

hope that helps you mate.
 
you need to add it to the Pinescript in tradingview. I've used TV to get some ideas or to add to a system to a chart to see what it would work on, but I don't code in pinscript. THe code I provided you will be ready to add in.

My suggestion. Find an EMA crossover strategy and replace "close" with "high" and "low" and mod the entry conditions. To write it in pseudo code itd be something like

emahigh10 = ema(high, 10)
emalow10 = ema(low, 10)
atrval = atr(10)
atrmod = 0.5
long = C > (emahigh10 + (atrmod * atrval))
short = C < (emalow10 - (atrmod * atrval))


Note that this isn't actual pinescript just how I would be looking to write the basics of the strategy. you could also use ATR as position sizing.
 
The bands in the above script is something I definitely want to have: the high avg price over period X, and the low avg price over that period
 
The bands in the above script is something I definitely want to have: the high avg price over period X, and the low avg price over that period

I think this is a two part process.

So you want to find an average over X periods.
Once you know that you want a horizontal line
across the chart at that value.

If that's right you just need to plot the average of both the high and the low
Take today's value and place a horizontal line across to page at both the
high and the low. There will be your envelope.
 
It gives you the average high and the average low over x periods on that day.

If that’s not what your looking for I’m afraid I don’t grasp what your trying to do and what it will achieve for you.
 
Top