- Joined
- 21 February 2014
- Posts
- 26
- Reactions
- 15
Hi tech/a, great thred! What are your interpretaton for the charts on the stocks NCZ, RCL and ACF?
Firstly what are you scanning for
What is your criteria??
!
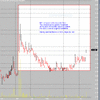
Here is the latest NAN. It broke out above the box and has closed above it for 2 days.
It has already tested the box but I am not sure if it has to test and hold above the box.
View attachment 88371


tech, you may remember having lunch at our place in Cairns many years ago where you tried to convince me I am eminently suited to go deeper into the technicalities of charting. Well I tried, and it was all too hard and complicated so I have stuck to the very simple system I have explained elsewhere here.As an Exercise........
........what would you be doing given the charting analysis.

But try to read anything else
And it’s of little value
As an Exercise
Im trading this what would you be doing
given the charting analysis.
It was originally in my watchlist for the pattern
after picking up the V/Bar.
The very low volume caught my eye in the retracement
of the V/C bar that pretty well ALWAYS happens and again
in the second pattern (Relative to the volume in the Bars
immediately before them).
View attachment 88377
I’m thinking you might be thinking of pyramiding.As an Exercise
Im trading this what would you be doing
given the charting analysis.
It was originally in my watchlist for the pattern
after picking up the V/Bar.
The very low volume caught my eye in the retracement
of the V/C bar that pretty well ALWAYS happens and again
in the second pattern (Relative to the volume in the Bars
immediately before them).
View attachment 88377
I’m thinking you might be thinking of pyramiding.
You could move your stop on the original buy to underneath the new vcb?


Hello and welcome to Aussie Stock Forums!
To gain full access you must register. Registration is free and takes only a few seconds to complete.
Already a member? Log in here.