Australian (ASX) Stock Market Forum

Volume-Price-Patterns-Context & Catalysts, an Application to Trading Stocks

Is this thread useful?

  • Yes

    Votes: 72 96.0%
  • No

    Votes: 3 4.0%

  • Total voters
    75
@tech/a, I am going to put up a challenge for both of us shortly. I have reduced my indicators to only three and intend to focus more on these three, now including the volume. I won't say I have a handle on volume, I see my love affair with volume as still in the 'let's go for dinner' stage!
Before I used to simply glance at the indicators, which did not include volume, now I am going to attempt to integrate them into my buy strategy.
 
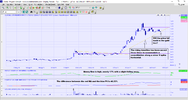
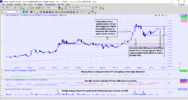
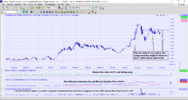
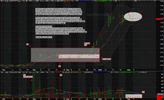
OK, I am looking to buy a small Lithium stock. There are three candidates I have chosen to chart. All three look quite similar. Two are @tech/a choices CXO and LPI and my choice is GL1. All of these are in blue sky territory, other than what is currently above the price over the recent past. They all have their strengths and weaknesses. I am going to ask @tech/a or anyone for that matter... @peter2 or anyone who would like to join in with their opinion using the indicator of volume. What can volume tell me I am not already seeing on my charts? I would have added another stock I am watching which is ABR but that is about to do a 1:10 consolidation and list on the NASDAQ and get a name change. I would rather stand aside while all this happens and I doubt the current chart would give me a true indication of how well it will travel in the future but I could be wrong. I may be missing out on a gem. So be it, I will just buy in higher, or not.

My first choice would be GL1 because it has good money flow of 17%. It is a young stock and has just started on its upward journey with no baggage from past history.

Second choice would be CXO as it is showing a slight lift in the money flow but it is still just sitting above 0%. It has a good percentage difference between the MA and the PV on the PVI. But overall the three stocks all have a good looking PVI. This tells me there is positive market sentiment toward all of them. (Yes I know it is regarded as an indicator of what the dumb money is doing but there is a lot of dumb money out there, I don't care what the fundies are doing, they have their own agendas.)

My last choice would be LPI, it had a volume spike and looking at the money flow it appears to be a sell-out and the money flow is still falling away but now at a slower rate sitting just above 0%. There is a horizontal above the price which was taken from the recent high volume spike of a possible sell-out, I have to ask the question, will market sentiment cause this horizontal to act as a resistance to any further price rises?

Edit.. of course, it is all moot if the lithium price falls!

GL1 chall 11.2.22.pngCXO chall 11.2.22.pngLPI chall 11.2.22.png
 
Last edited:
I am watching with great interest
Are you saying that they are BUYS and not SELLS?
I am actually waiting for ABR to get itself organized before I make any decisions. I simply thought it was an interesting exercise as all three stocks looked fairly similar to each other.
Despite lithium price being exponentially high, unless a huge new supply comes on soon and hard, a fall is unlikely, IMO.
Markets overall are a different story however :2twocents
Yes, I tend to agree with you FR, even if Lithium continues to remain at its current level, if the markets take a further dive, I would think these three would follow it down.

It's clear that these three are Synergistic to Nickel Pricing.
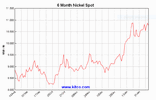
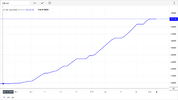
I think the Lithium price while a bit smoother is also displaying the rapid rise and levelling off. I am not surprised as they are all battery associated.

Lithium 9.2.22.png
So I won't look at all charts just GL1
Your chart captions and highlights are ideal, thank you!

I did notice that low volume area at "C" without any falling away of price levels. It feels to me as though people are just marking time before the market tells them one way or another which way it will go. So we agree, out of the three GL1 may be the best choice? However, none of my indicators or your volume assessment makes me want to enter a trade just yet.
 
Clearly I meant Lithium!

Ann I’m looking at GL1 because its the one you like most.
The analysis doest show a reason to buy just a story going forward
 
Ann I’m looking at GL1 because its the one you like most.
The analysis doest show a reason to buy just a story going forward
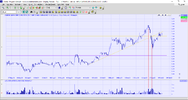
I was and am hoping volume may give me a degree of indication as to which to buy going forward. So far ABR has the best looking volume spikes related to peak and trough price and that would have been the one I would have bought but not in the middle of so much happening to it. Although it is a more expensive stock than the other three speccies. Probably because this isn't a speccie!

ABR volume spikes 11.2.22.png
 
Ahoy Brave and Not so loyal 1st Officer ANN

When I advised you privately to discard the price charts and the volume charts and sail on instrumentation only
I was not joking

These charts are dated as at Friday 11th
 

Attachments

  • GL1.png
    GL1.png
    25.9 KB · Views: 31
  • LPI.png
    LPI.png
    30.3 KB · Views: 30
  • A4N.png
    A4N.png
    30.4 KB · Views: 23
  • CXO.png
    CXO.png
    30.9 KB · Views: 20
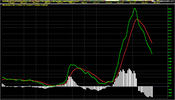
The opposite way is to remove all indicators, only keep a moving average and MACD.

MA is to know the direction of the trend (or no trend) and the relative distance the price is from the MA. MACD is to see the momentum.

I found volume indicators are quite confusing to interpret. I've given up on them because we trade price, not volume.

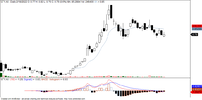
From this chart, I wouldn't touch GT1 for the time being.

gt1.png
 
Top