Australian (ASX) Stock Market Forum

Volume-Price-Patterns-Context & Catalysts, an Application to Trading Stocks

Is this thread useful?

  • Yes

    Votes: 72 96.0%
  • No

    Votes: 3 4.0%

  • Total voters
    75
Personally, I prefer to read and search rather then pollute this cyberspace with trivial questions, but please know you're making a difference to my share trading education.

Hi Jon, just wanted to make a quick point here. Questions are vitally important parts of threads like this one. Some of the best posts come in response to questions from other forum members. Questions help flesh out and expand a topic and help not only the person asking the question but also those who read the thread afterwards who may have had the same, or similar, question.

So if you have any questions don't hold back from asking. I am sure that @tech/a would be more than happy to respond when he has the time to do so.
 
I for one would really like you to keep this thread going @tech/a. I struggle to see the relationship between chart movements and volume. I can work profitably with all the other indicators, trendlines and horizontals but volume eludes me. I think it could add another weapon to my arsenal if I was able to relate volume and price.
 
Ok I’ll do some more when I get some time
Guppy was in your boat as well
To me it’s an indicator of supply and demand in fact I’ve found very low volume in some circumstances to be a greater leading indicator than high volume
Supper high volume is generally climatic

a bit to this as an indicator but handy for me all the same
 
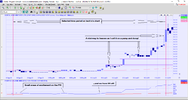
In the same context, is Mark Minervini's VCP (Volume Contraction Period). It worth looking for these after high volume price spikes.

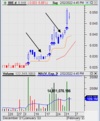
Two examples in this chart. Note after the high volume price spikes, volume drops off significantly while price drifts sideways with hardly any range (small tight bars). then BOOM

ex3.PNG

It's not just a tactic for short term traders only. You will see this pattern on all timeframes, weekly, monthly, qrtly etc
Once supply is depleted (or withdrawn, which is a good suggestion from @tech/a) price has to go higher quickly.

It's a good timing tactic to get into a new trend near the start and not have an awkward drawdown at the start of a trade.
If you do experience the awkward drawdown then perhaps your timing isn't right. Take the small loss and keep watching for the next opportunity.
 
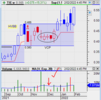
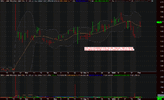
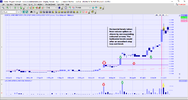
Another chart example of a VCP (Volume Contraction Pattern).

Weekly chart of TIE ( soon to be gold producer Cote d'Ivoire)

TIE1.PNG

A VCP can form anywhere in the range, top, middle (like this example) or bottom. It's an opportunity to start a trade with a small initial SL which maximises the R:R outlook.
 
Supper high volume is generally climatic
I have been working on this for a part of the day. Very interesting! As you say it appears at the very top or the very bottom generally and drawing support resistance horizontals from these particular points can be very beneficial, which is not earth-shattering as some charting programs have horizontal volume, which sadly IC charts do not have. I pleaded with Colin Twiggs back in around 2005 to please put in horizontal volume, sadly he just told me to look at the Equivolume chart. It is just not the same.

To me it’s an indicator of supply and demand in fact I’ve found very low volume in some circumstances to be a greater leading indicator
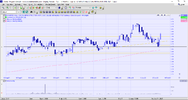
This is interesting I will spend some more time looking at low volume. I have noticed generally my existing horizontals marry very closely to the 'new lines' the volume levels bring. Small adjustments may make the difference between a buy or sell before it is appropriate. As in CQE, not that it was a small difference in the horizontal, on this occasion my fail line was $3.57 and the volume level was $3.70. I felt my fail line would take too much profit off the table so I sold after it broke a rising trendline at $3.73. Had I had that volume horizontal I would never have sold. $3.70 would have been a better decision point.

CQE volume 2.2.22.png
 
Studying Volume IMHO is like watching a game of Swaps in the school yard
One BUY is cancelled out with One Sell
I call this a DRAW
100,000 Buys is also cancelled out by 100 ,000 Sells
I call this a DRAW also

The fact is that on the ASX you can only have a Sell if there is a BUY
'Tis like a perfect match as is made in heaven
ONE (1) BUY + ONE (SELL)

Volume analysis started off in the beginning because it was an easily documented statistic
and the only stat in those days
AND still is to this day

I don't care how many kids are playing SWAPS in the schoolyard or what their parents are SWAPPING on the Sharemarket
It gives me no insight as to who SWAPS best

VOLUME studies in "OPEN INTEREST" is another story
This is not a game of SWAPS

I hope this helps
AND
It is only My Opinion

Bon Voyage and Stay Well
 

Attachments

  • Bear Hunter.jpg
    Bear Hunter.jpg
    20.8 KB · Views: 10
Studying Volume IMHO is like watching a game of Swaps in the school yard
One BUY is cancelled out with One Sell
I call this a DRAW
100,000 Buys is also cancelled out by 100 ,000 Sells
I call this a DRAW also

The fact is that on the ASX you can only have a Sell if there is a BUY
'Tis like a perfect match as is made in heaven
ONE (1) BUY + ONE (SELL)

Volume analysis started off in the beginning because it was an easily documented statistic
and the only stat in those days
AND still is to this day

I don't care how many kids are playing SWAPS in the schoolyard or what their parents are SWAPPING on the Sharemarket
It gives me no insight as to who SWAPS best

VOLUME studies in "OPEN INTEREST" is another story
This is not a game of SWAPS

I hope this helps
AND
It is only My Opinion

Bon Voyage and Stay Well

In the majority of trading I couldn’t agree more..

But that’s not where the gems are.
They appear as extremes. They appear as outliers in some cases.
They appear as anomalies where you just have to say —- that’s not normal and
the combination of this and that commands my attention.

Why —- because I’ve seen it countless times before and it is generally an opportunity which needs to be investigated.

It could be beneficial or costly .

Its like reading people.
Most can’t —- some can. It’s not an exact science but in the hands of those who are good at it —-insights are invaluable.

Later—-
 
Studying Volume IMHO is like watching a game of Swaps in the school yard

Ah yes, swap cards at school. The only thing that would draw me out to have contact with other children, trading! I started with a few cards maybe five or six and ended up with so many I couldn't hold them in one hand. Bloody loved trading, it was my only pleasure at school. I still have them, there are some awesome cards there, I probably should have them valued, there may be a bob or two of value there.

Studying Volume IMHO is like watching a game of Swaps in the school yard

I couldn't see anything in volume, it seemed just short of a wank to me!

VOLUME studies in "OPEN INTEREST" is another story
This is not a game of SWAPS

Yes, it is Captain, when there is a swap over it is really time to pay attention.

But that’s not where the gems are.
They appear as extremes. They appear as outliers in some cases.
They appear as anomalies where you just have to say —- that’s not normal and
the combination of this and that commands my attention.

Exactly what I have discovered, or believe I have discovered with volume spikes and horizontal support and resistance. No more guesswork, no more simply eyeballing it, now I can have volume precision with my lines. I feel I can see already where I can make money using volume spike horizontals.

Its like reading people.
Most can’t —- some can. It’s not an exact science but in the hands of those who are good at it —-insights are invaluable.

I am pretty good at reading people. There were a number of people I communicated with on the IC forum. Some were the real deal and some were losers who had little else in their lives and made 'big men' of themselves and told others how to trade. When I finally met them in person, I was so, so right about all of them.

Another chart example of a VCP (Volume Contraction Pattern).

Weekly chart of TIE ( soon to be gold producer Cote d'Ivoire)

TIE1.PNG


A VCP can form anywhere in the range, top, middle (like this example) or bottom. It's an opportunity to start a trade with a small initial SL which maximises the R:R outlook.

Thank you very much for taking the time to draw a chart and show me what you are looking at Peter. I have spent a little time looking at low volume days and I notice when the VCP section is rising or creating a rounding top then a fall tends to follow. A level pattern as you have illustrated tends to lead to a rise. Most interesting!

However, I am now very interested in using volume spikes as a point at which I will draw a horizontal support/resistance line. The short term VCP reading would be a real boost for a day trader, this is not me. This seems to be the missing ingredient I have been looking for, for years! I still have many, many more hours of work on this before I am satisfied I am correct. I am very excited by volume and horizontal support/resistance now! ?

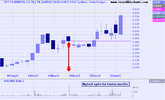
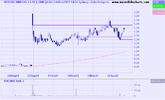
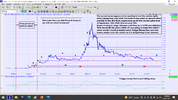
Looking at the same weekly chart example of TIE with a volume spike and horizontal support. Let's see how it goes.

TIE V spike 5.2.22.png
 
Last edited by a moderator:
But that’s not where the gems are.
They appear as extremes. They appear as outliers in some cases.
They appear as anomalies where you just have to say —- that’s not normal and
the combination of this and that commands my attention.

Why —- because I’ve seen it countless times before and it is generally an opportunity which needs to be investigated.

It could be beneficial or costly .
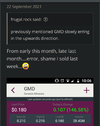
An example, if I may @tech/a

On 30th August, 2021,
I noticed a random single huge volume trade on GMD. 30 million in volume.
Off the back of this anomaly, I bought some but sold after around 2 weeks or so (mid September) as no event occured.

Around a week after I sold....
this... grrr.

Screenshot_20220205-174654~2.png

I've now adjusted my anomaly expectation horizon to 4 weeks rather than 2 weeks.

GMD is now trading at $1.70...
(I nearly fell over backwards seeing this today.... and yes, found it consolidated 10:1 in January)
 
Interesting to see how this travels. I absolutely hate consolidations, I have been burned so badly, I call them legalized theft. I am sure some of them work out but I don't want to be there when it happens.

GMD 5.2.22.png
 
Greetings.

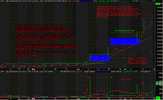
It takes quite a while to mark up a chart for people to digest.
This is a fascinating and very profitable topic so it's worth in my view
the effort. I've decided that the best way to bring people up to speed is to first show
what it is they should look for.

Each chart is NOT exhaustive I can only show a little at a time otherwise you'll have trouble putting it all together.

THE KEY, in the END, is to be able to READ A CHART with a good deal of accuracy GOING FORWARD

Bear with me as I continue to add charts when I get a chance.
Practice on charts you may find yourself and see if you can read what is happening NOW

Master class 1.gif
 
Hello Ann
Re volume and price, I am also a follower of @tech/a and his substantial contributions to this forum. His studies follow some of the Volume Spread Analysis (VSA) ideas and there are a number of books available online on this subject. The one by Anna Coulling is a good place to start.

And this software manual is another, a bit more advanced. https://www.aussiestockforums.com/threads/vsa-free-master-the-markets-by-tom-williams-pdf.13804/

Yes I agree I have her two books one on FOREX.

As time goes buy youll see some of my own slant on most things Volume and price.

Here is another excellent free source (185 Pages will keep you busy until I get back!)

Please post your own findings and prospects for us to look at Long and or short!
 
This is a quote from @frugal.rock post "GMD is now trading at $1.70...
(I nearly fell over backwards seeing this today.... and yes, found it consolidated 10:1 in January)"

Just a few observations. Consolidations are best served FRESH!

Talking about a different consolidation John, a 1 for 10 share consolidation or 'reverse share split' is when a company for whatever reason wants to appear to increase the value of their company or reduce the number of outstanding shares so for every 10 shares you hold, like magic it all of a sudden becomes 1 share. The last price was say .71c and let's say you held 10,000 shares which would be $7100. After the share consolidation you own 1,000 shares. Current close is $1.69, my very feeble attempts at maths looks like I now have the grand total of $1690. These figures are subject to correction. However I think I got it right, if I did then you can see at a glance the kind of daylight robbery this is. From memory, I think the consolidation I was caught up in was a 1 for 80. Decimated!
 
Nup, not what I thought, ignore the above...this happened in January, nothing much happened, which seems strange the huge lift in price happened back in September 21.

......No idea, I just spent more time than I want trying to read notices. It almost seemed like the directors did a 1:10 dunno. I will leave this for someone else to figure out. However, with all this sideways consolidation (not share split) there are going to be powerful numbers added to this $1.50 to $1.80 level added to the massive spike of 21 million in September 2021 and 13 million in November 2021. It will be interesting to see how it travels once it is above 1.80 ish.
 
Last edited:
Wow, never been involved in anything like that, if my 10000 at .71 were to become consolidated I would expect 1000 at 7.10. The last consolidation I was involved the share price was about 4 cents (1 for 5) so they went to 20 cents and then promptly fell to 13 cents over the next month.
Try to avoid the small companies with billions on issue, although I do hold one at 1.5 cents expecting some consolidation in the not to distant future.
 
Just for the record I was holding GMD when they consolidated the number of issued shares.
I held 46,600 and they were trading at 0.175 (Value = 8155).
Post consolidation I held 4660 at a price of 1.75 (value = 8155)
There was no "robbery". When trading resumed the MD was very thin and I sold as drifted down not wanting to get stuck without any buyers. The MD thickened up soon after I sold.

A few companies seem to be consolidating their shares in order to raise the price, prior to listing on another exchange (eg. US).

Consolidations of the bad kind happen in the micro cap sector as CEO's try to hide the fact that the price has gone nowhere for years and yet need to raise capital once again. Reducing the number of issued shares hides this ASX enabled thievery.
 
Top