Very good contribution ..
It is about identifying the principles
whether it is on Tim's 3 min chart
or a daily chart.....
The difference between the trading of the two
is seen in terms of aggressiveness , frequency , and magnitude .
Not a difference in principles..
eg Tim might buy in a Selling climax after a clear Preliminary Support
nomore would be wise to wait for at least a clear LPS
It is the SC that ends the down trend
The trader identifies a cause large enough for the effect ( the move ) they want to capture...
The terms used may seem familiar but strange
A LPS ( last point of support ) is what it signifies... The last point of support
it is not support "NOW" but the last point where demand was seen to overcome supply....... Important aspects of a LPS is the depth , duration and of course always the volume......
I would add rather than against or with the public
nomore's chart is a tool to track this Composite Operator ..
High Volume should always be noted
it is effort and some result will follow......
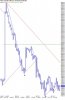
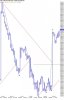
Here is a start the bottom chart is the XAO
The Volume is of MCR.......
It is a Study of Responses
Is the large volume bar telling in anyway ?
when seen in some context .
What was the CO doing on that day when the XAO went down !
or is there some simple explanation for that volume ( I am only looking at the chart") )
)
The CO ( or CM ) is they, is professional money , it is those who know.. But it also Mr Market. It has away of making people buy at tops and sell at bottoms
Fear Greed and Boredom....
Because it is a comparative study I have used a log scale
motorway
It is about identifying the principles
whether it is on Tim's 3 min chart
or a daily chart.....
The difference between the trading of the two
is seen in terms of aggressiveness , frequency , and magnitude .
Not a difference in principles..
eg Tim might buy in a Selling climax after a clear Preliminary Support
nomore would be wise to wait for at least a clear LPS
It is the SC that ends the down trend
The trader identifies a cause large enough for the effect ( the move ) they want to capture...
The terms used may seem familiar but strange
A LPS ( last point of support ) is what it signifies... The last point of support
it is not support "NOW" but the last point where demand was seen to overcome supply....... Important aspects of a LPS is the depth , duration and of course always the volume......
Remember what Wyckoff teaches in step one of the Wyckoff method. Knowing the position of the price in the trend is as important as knowing the direction of the trend.
All up trends and down trends are the result of a series of trusts in the direction of the trend separated by corrections. Some individual issues that are in harmony with the market from the stand point of the direction in which their trends are pointed will make relatively larger thrusts and experience relatively smaller corrections than the market as a whole.
These are the issues that are most likely to have the best potential to produce a profitable trade. Relative strength or weakness can be measured as soon as the first thrust in a trend has been completed. This will likely be even before the trend channel has been clearly defined.
http://www.wyckoffstockmarketinstitute.com/wyckoff_step2.htm
Traders respond to input based on the model of the market they have
built for themselves. A positive response grounded in Wyckoff's
theory of the Composite Operator will have distinctly different--and I
would argue, consistently more profitable--outcomes than will a
negative response to input based on the theory of Contrary Opinion.
Understand and work with the Composite Operator--rather than against
the Public.
Pruden
I would add rather than against or with the public
nomore's chart is a tool to track this Composite Operator ..
High Volume should always be noted
it is effort and some result will follow......
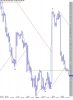
So would Wyckoff Method agree that MCR is in the bottom of a progressively higher peaking and higher support level cycle that could see my predictions come good? and is the path of least resistance upward with a spiking nickel price?
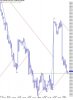
Here is a start the bottom chart is the XAO
The Volume is of MCR.......
It is a Study of Responses
Is the large volume bar telling in anyway ?
when seen in some context .
What was the CO doing on that day when the XAO went down !
or is there some simple explanation for that volume ( I am only looking at the chart
)The CO ( or CM ) is they, is professional money , it is those who know.. But it also Mr Market. It has away of making people buy at tops and sell at bottoms
Fear Greed and Boredom....
Because it is a comparative study I have used a log scale
motorway