Australian (ASX) Stock Market Forum

The official "ASX is tanking!" panic thread

At the moment, the ASX200 is echoing the S&P500’s overnight move, erasing 3 sessions of gains, but holding above last week’s lows.

It will be interesting to see what the follow-up reaction is in the US today, as speculation on the Fed’s rate hike path will likely play a key role in near-term direction for global markets. Will the Fed maintain an aggressive pace of tightening over the coming months, or is there still scope for them to pivot after next week’s FOMC Meeting?

All trading carries risk, especially given the variety of other fundamental factors influencing currently influencing investor sentiment. However, this could help determine whether the market finds support around last week’s lows, or if its break below and targets a retest of the June low.
 
If one was of the opinion that the S&P 500 was going to hit new yearly lows eg. low 3000s late next month (as theres a partial eclipse due then..) and one wanted to place a short on the ASX stock market. (Buy put options).
Could anyone please suggest what stock on the ASX would likely decline the most or at least in line with the US S&P 500. Or a ETF.
But Im after something with American expiry system (ie. can settle any date not a fixed date like the european option system) So unfortunately the ASX200 index is not suitable as it only has European fixed date expiry options.
Thanks!
 
Friday dump day lives on... 2.3% down so far
It's on for one and all. Monday looking "interesting"

Headlines on Saturday morning:

US stocks fell, with the Dow briefly shedding more than 800 points, as investors rushed to sell. Oil plunged, gold fell. $A near US65.25¢.
 
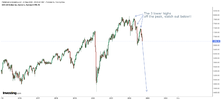
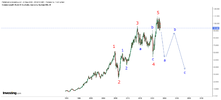
Bearishly we continue...... And it ain't over yet. We should get a bounce at obvious support maybe on the daily or weekly chart and then wait for the capitualtion move down to test the pandemic lows. God bless you Robert Prechter who has shown what is really driving long term cycles. Natures law ( Fibonacci Time cycles and it can't be any other way). Great call on the stock market, interest rates and commodities from 2 years back. The following chart exhibits an interesting pattern of trend shown to me by Bill Mclaren. Three lower high off the peak, ie wave 3 of 3 of 3 in EW jargon...

z136k.png


Enjoy the volatility, large ranges and short term trades. Trades everywhere...

Timewise based on cycles we should get a low about mid next year although that may not be a price low but a cycle low. When I say cycle low if we get a capitulation move down in October then market will probably bounce sharply for a bottom but after a period of months will drift back lower and re test the lows but not make a new low or a false break low.
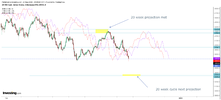
I have been following some JM Hurst/Eliades Cycles analysis. Based on the 20W Nominal cycle the SPX is projected lower to 3335/3357. After this is met, the market can do 3 things: 1/slice through it, 2/reverse and give a new upward (smaller) projection, 3/ consolidate and pause the downtrend and then give a new downward loop projection. However at this point in time the only projection are downward and the only one active is the 20W. This is where is gets relly interesting because the offsets for the 4 year cycle are at approx 3451 and crossed and it will be if 20W projection of 3335/3359 is met giving a new nominal 4 year cycle projection of around 2000.


z133s.pngz1365.png

On a side note, someone in this forum who shall remain nameless and liked to tout a useless trading system which only they understood, said we should only ever buy bank stocks..... Yeah good luck with that..... So goes CBA and the big four so will the Australian Property market in the same direction!! Don't hold anything but cash, or short plays atm. Especially cash because the buying opportunity of a lifetime will be on the horizon soon... But I doubt here will be as many ppl interested as for example the last 25 years. There will be too much fear, only the contrarians will be picking up the piecees!


z137a.png
 

Attachments

  • z1371.png
    z1371.png
    127.3 KB · Views: 9
Last edited:
@gartley why is the low projected to be at the mid of 2023? Is that because it's coinciding with the peak of the Fed rate hike cycle? Have you accounted for the fact that the Fed is also planning to keep rates high for a period of time - this would presumably make equities far less attractive compared to fixed interest products.
Then of course we'd need to keep in mind that this could all change if inflation surprises downwards.... More likely to happen if crude remains low + housing starts to fall
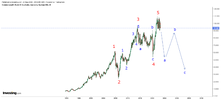
I can't say much about the fed it's not my thing. The time cycle projection is from Lars and the foundation for the study of cycles. We need to be careful here as I mentioned before, because a cycle low does not always coincide with a price low. That low in 2023 won't be the final low but only a big b wave rally. I think we have to look at things from a long term basis. 1/ This will probably be a long term bear market, 2/ there will be tradeable rallies ( may of them) in this bear market. A tradeable rally will happen very fast and a stock that was trading at a certain level and has fallen substially has the potential to double or triple your investement quickly. My 2c worth is that this market will find an ultimate low at the same level somewhere near the previous 4th wave of one less degree which was near the GFC low at 3000/3100. That goes the the same with the property market too. It will a long one.

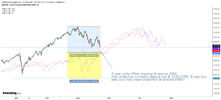
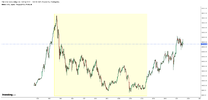
Look at the nikkei bear market chart below of a real long term bear market and the types of rallies to expect in US stocks. At this point in time as mentioned if the 4Yr cycle projection is activated things are not good. As an example of how useful these cycle projections are, look at the cycles met in the pandemic selloff and recovery below:

z13ff.png
We need to be patient and IF the market does what the projection model suggests ( meet a level) THEN look to momentum indicators and dynamic cycles to validate a trade or entry. The same as the pandemic low:
z13g2.png
 

Attachments

  • TDI 2020.xls
    64.5 KB · Views: 8
Last edited:
It hit the lowest level in nearly 2 years, but it could be worth noting the S&P500 has pared losses during both dips to new lows this week to close above the June lows. Potentially a sign of stocks finding demand around these levels?

All trading carries risk, and although the fundamentals are not supportive of total shift in momentum and sustained rebound, perhaps market is looking to base for the near-term.
 
Top