Australian (ASX) Stock Market Forum

Tech/a Techtrader - my questions

Data: using yahoo finance. This gives you adjusted OHLC which accounts for all splits and dividends. However, if I use this, it is a little hard to compare to XAO unless I can easily split out the dividend yield.
Now, I am not familiar with this particular data source, but if it adjusts for splits and dividends, why not use an index based ETF as your benchmark?

There are a number of ASX listed ETFs which aim to mimic XJO or XAO. Just choose one of those, and let your data source adjust prices for any dividends or distributions that they pay. Easy.

KH
 
Good points thanks Rob and KH

I will do an amibroker comparison and excellent point to compare to asx ETF.

No point in going through the heartache of trading if you can simply buy an ETF.

Or indeed, may as well try TT on the ETFs....
 
Today’s bar CROSSES the last highest high over the last 10 periods
so there must be a peak that is being crossed that occurred in the last 10 periods
AND today’s high must be the highest high for 70 periods

Do away with Condition 1 and your not trading tech trader.
Youll just be trading any close which is the highest in 70 periods.

Think about it.
peak —- pull back —— another new high.
AND above a 40 day EMA so that it’s not just inside a flat accumulation stage.

Love ya work —- tech
 
Thanks Tech - love your work too!

Are the amibroker code and comments correct for conditions 1 & 3 ?

cond1=Cross(H,Ref(HHV(H,10),-1)); //todays high crosses last highest high over the last 10 periods

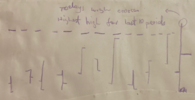
See attached (though this example may fall foul of other condiitons).
I would say that if todays high crosses the highest high of the last 10 bars, then it must also be the highest high of the last 10 bars.
If it is highest high of the last 10 bars, then it must also be the highest high of the last 70 bars.

I see in another post you wrote: "For those with Metastock here is the code.
ENTRY
Cross(H,Ref(HHV(H,10),-1)) AND H > Mov(C,40,E) AND HHVBars(H,70)=0 AND C < 10.00 AND C > O AND Fml("Liquidity") > 500000;"

So the amibroker code seems to be correct.


As an example, I have ran the code from 16/6/99 to 31/10/21. (but without the monte carlo analysis - that will come next)

The total return is 10.9% compounded p.a - marking to market close the value of open positions as at 31/10/21 (although possibly only closed positions should be considered).

The equivalent xjo for that period is 4.5% compounded p.a, and the yield is approx 4.5%.

I wasn't able to find an ETF with 20 years history but will keep looking. IOZ, VAS

So on the face of it:
  1. Techtrader seems to outperform xjo by almost 2% (compounded over 21 years, this is a lot). The proviso being that the TT universe I used is wider than the xjo.
  2. The volatility is far lower (just compare TT position graphs vs xjo).
 

Attachments

  • cross H HHV.PNG
    cross H HHV.PNG
    1.1 MB · Views: 21

As of June 30, 2021, that $10,000 in the SPDR® S&P®/ASX 200 Fund (STW) would have turned into $48,789. Meanwhile, the $10,000 in the SPDR® S&P®/ASX 50 Fund (SFY) would be worth $46,230, assuming all distributions from the funds were reinvested.

The above is for 20 years.

For the TT period of about 22.3 years, the answer would be $88k (in my single run of buying whenever there was capital available, including a flat $20 buy / sell cost, and a position size of $5k)

Not sure why the above fund is only returning $46k - maybe the average xjo yield is far lower than the 4.5% I posted previously


**** But I haven't included CGT **** which should be included as hold times of <1 year will not get the 50% CGT concession, but holding an ETF would give you a CGT concession
 
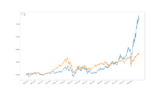
Just an update - this is what I have with mark to market numbers (open trades evaluated to close each day)

Please keep in mind differences from real TT
a) Not using BT margin list.
b) Not using the 10% stop (selling the next open as I thought this was the best I could realistically do.
c) Only one run

So while the returns look good during certain periods, it isn't something I would trade.

I can work out solution for b,c but not sure what ill do for a) unless can get historical list.
 

Attachments

  • Figure_1.png
    Figure_1.png
    130.5 KB · Views: 11
Are the amibroker code and comments correct for conditions 1 & 3 ?

cond1=Cross(H,Ref(HHV(H,10),-1)); //todays high crosses last highest high over the last 10 periods
I'm not sure if you have this sorted or not, but I don't see any further comments on it.

The important part of condition 1 is that it needs to cross the highest high over the last 10 periods. i.e. Yesterday's high was not the highest high in the last 10 periods, but today's bar is. You're waiting for a brief pullback, then trading the breakout from that pullback.

I would say that if todays high crosses the highest high of the last 10 bars, then it must also be the highest high of the last 10 bars.
Yes, but the important part here is not just that it is the highest high, but that it crossed the highest high of the last 10 bars.

If it is highest high of the last 10 bars, then it must also be the highest high of the last 70 bars.
This isn't true, but the opposite is true (and maybe you just wrote it the wrong way around). The if a bar is the highest in the last 70 then it must also be the highest in the last 10. But a bar can be the highest in the last 10 without being the highest in the last 70. Think of a chart coming out of a downtrend. But again, cond1 is about breaking out of a small pullback, not just being the highest.

When backtesting Techtrader, don't forget that there are two other conditions that are not defined in the code. It's for the trader to apply these two rules by looking at the chart before taking the signal.
- It must be in an obvious uptrend or obviously breaking out of a downtrend.
- It must not be stuck in a trading range.

Isn't that covered by "AND above a 40 day EMA so that it’s not just inside a flat accumulation stage."?
 
Techtrader is the most tested/bastardised and fiddled with system I know of.
The last time I saw this system traded correctly was 2002-2008.

Yet everyone has an opinion of every version they play with.
Call whatever you design whatever you want but not Techtrader.

Appreciated.
 
Isn't that covered by "AND above a 40 day EMA so that it’s not just inside a flat accumulation stage."?
Without looking through the charts, I'll vote no. Once price has been in a range for 70 bars it shouldn't be hard for price to be above both the 40EMA and the 70 period HHV and still not be in an obvious uptrend.

This is not based on experience as I've never traded it. I'm just stating the rules as listed in the original Techtrader since people tend to stumble across the code and not realise there were additional rules.
OK, i can see if the price jumped say 50% it would quickly get above the 40EMA without being in any real uptrend.
 
OK, i can see if the price jumped say 50% it would quickly get above the 40EMA without being in any real uptrend.
I had a quick look. This is what I was thinking of. Green line is the 40EMA, the right most bar is a valid entry if looking only at the code. There weren't that many in my sample. Most of the time it seems it's actually the volume filter that keeps you out of these. Stocks that go nowhere for long periods of time tend to fail the turnover filter.

1636373241947.png
 
Thanks for the responses all - yes I miss-wrote the comment about the 70/10 day highest high.

However, I will get amibroker and just do the code exactly as is. The only thing I can't seem to get is the BT margin list other than the current one. We can't really use that as it wouldn't be valid for 20 years ago (eg I'm sure ABC learning was on the BT margin list before it went bust)

The only thing I would struggle with is:
When backtesting Techtrader, don't forget that there are two other conditions that are not defined in the code. It's for the trader to apply these two rules by looking at the chart before taking the signal.
- It must be in an obvious uptrend or obviously breaking out of a downtrend.
- It must not be stuck in a trading range.

- this would involve inspecting each entry (or writing an algorithm but then it wouldn't be TT!)
 
When I first set to work on this I designed it on a universe of stock under $10 obviously many eventually traded well above that when we held them in some cases for years.
I wanted to trade on margin so used BT they had a list you could trade
my thinking was that if it was in their list then they must have liked it fundamentally.
My searches were based on the current BT list as my trading universe

Not my testing universe. As it turned out it was robust enough to do well on that universe.
Which Monte Carlo analysis alluded to.

I decided to not get tied up with semantics— maybe right —- maybe wrong.

FYI I don’t trade the original TT but do trade a version in my Superfund.
I know of one guy that still trades the original and last time he made contact was doing really well
 
Attached are the results for anyone interested. If you unzip somewhere, you should be able to open stats.html

Both are based on the current BT margin list (with ETFs and Funds removed)

TT1 has all 5 conditions
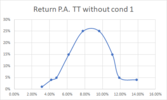
TT2 has condition 1 removed - yes they are different as condition 1 means that todays high must be higher than previous 10 HH, not higher or equal to the previous 10 HH.

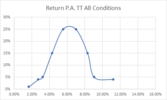
Montecarlo analysis done but just in case people are confused with the MC output format, here are charts that may be more understandable. I wouldn't read too much into the appearance that removing cond1 seems to give better return - I suspect these results are not representative because the current BT list is used which certainly wouldn't have been valid 20 years ago

Note this is using 'unadjusted' yahoo data. From what I can see in the data, this is actually adjusted for splits but not divs.

Opening equity 100k, 10% position sizing. Buy/sell on OPEN


1636755446698.png

1636755461630.png


What this means for the second graph is 1000 runs were tested and of those 1000, 5% (or 20 of the runs) had a return of about 12% p.a.
 

Attachments

  • TT-orig.zip
    86.5 KB · Views: 3
  • TT-wo-cond1.zip
    89 KB · Views: 1
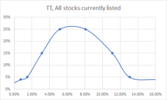
And attached straight TT, except all stocks currently listed on the ASX - ignore the BT margin list

1636774074105.png

Don't forget that using the currently listed ASX stocks means we have survivorship bias as well.

I think the entry in TT is fantastic. However we need a better exit strategy to more quickly exit on the 10 yearly 'black swan' events (dot com bust, 2008 financial crisis, covid panic)
 

Attachments

  • TT-all.zip
    92.9 KB · Views: 1
When Trading the original back in 2008 all held stock actually exited months before the Crash.
Are you using amibrokers Monte Carlo analysis?
Tradesim is a better Monte Carlo testing software.
 
Thanks - that's interesting I'll have to check the exits more closely. Maybe I was more concerned on the covid exit where a lot of the gain is from the recovery afterwards.

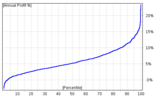
Yes Amibroker montecarlo - I don't think it is that intuitive. The best info is below but you don't get the actual data points to do a histogram like I prefer (which I think Tradesim does give you as you say)

1636776414148.png

This means 50% of the time the annual return is less than 5%, 85% of the time the annual return is less than 10%, 25% of the time the return is less than 2.75% or so. I get it, but not my preferred presentation.
 
When we ran it and about 1000 others back in 2000-2007 averaged about 24%
Radge also tested it extensively before publishing in his book and got very similar.

Today I trade a home grown method which I worked with others on. Some of the original is used.
For longer term Super.
 
Yes Amibroker montecarlo - I don't think it is that intuitive. The best info is below but you don't get the actual data points to do a histogram like I prefer (which I think Tradesim does give you as you say)

This means 50% of the time the annual return is less than 5%, 85% of the time the annual return is less than 10%, 25% of the time the return is less than 2.75% or so. I get it, but not my preferred presentation.

Just a word of warning on how Amibroker does Monte Carlo analysis analysis. It uses the trade list generated in your single backtest to create all the other runs. It does this by shuffling, omitting and duplicating the original trades randomly. But it's still the same trades.

It's better to add a random element to your buy condition and run that backtest 1000 times yourself to generate the different runs. Here's is a more detailed post by @MovingAverage on the topic.
 
Top