Australian (ASX) Stock Market Forum

Potential & Breakout trading--Technical tips and tricks

URF strong close yesterday @ 0.29c +7.41%
clear.png


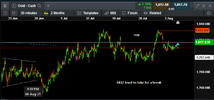
2 year daily price chart shows URF shaping up nicely after a rounding bottom / parabolic move up commencing with recent big volume/momentum kicking in.

Super bullish chart that looks a treat imo

https://www.marketindex.com.au/asx/urf

https://asx.swingtradebot.com/equities/URF:ASX


DYOR .. Cheers tela
 
You can play it long or short
short it’s clearly a breakout and clearly a huge winner.

what’s it doing in a breakout thread as a long play?
 
You can play it long or short
short it’s clearly a breakout and clearly a huge winner.

what’s it doing in a breakout thread as a long play?

Looked long to me due to the rise from June and it was going to follow the trend. It was generally heading up ish wasn't it?

Did it look like a short play to you tech?

Or, neutral, no real signals.
 
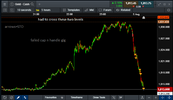
Haven’t time to pull up and mark a chart Kenna’s but try this

turn the chart upside down
I bet you can spot a breakout from
a nice base

the top is distribution
Upside down it looks like accumulation.

I’ll post tonight a chart if no one else does.
 
Potential breakouts ?
It takes me a while to construct my
Watch list so you’ll understand my
Reluctance in sharing it plus I know what I want from those on it to trigger a trade
Not that straightforward
I’ll throw a couple out tonight once I check today
 
Top