- Joined
- 19 August 2021
- Posts
- 249
- Reactions
- 736
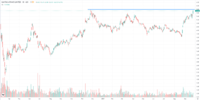
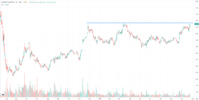
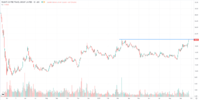
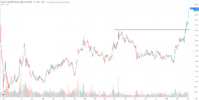
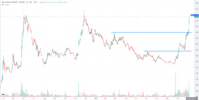
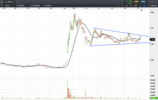
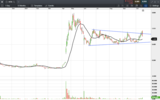
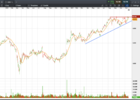
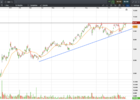
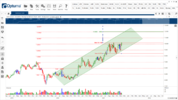
TLS has made an interesting pattern. There is a small breakout pattern that has developed over the past 6 weeks where a break above resistance suggests a target of $4.24. That being only a 6% gain on yesterday's close, it doesn't exite me from a risk reward perspective. However, when you look at the bigger picture there is a bigger potential resistance break given the earlier try at that level back in 2019. So a break above using that larger pattern suggests a meatier $5.30 target. TLS made what I believe to be a Wyckoff pattern over 2020/2021 (the rectangle) and that theory suggests a target of $4.25 (sound familiar?). There was (not drawn) a larger possible Wyckoff that gave a target of $5.70 that ties up nicely with potential overhead resistance. There's also a strong level of overhead resistance around $5.25 and that's my best guess where price might roll over - if it gets past the interim target of $4.24 (or in fact breaks ressitance at all - given there is a chance price could just fall back to continue the large sideways pattern). TLS announced some structural changes yesterday - perhaps that will be the incentive to break above a very strong level of resistance. My best guess (and it is just a guess) is that price will move up to $4.24, fall back to $4.00 to retest what will then be support, before heading higher. Could be long term hold prospect (while remaining aware of the current high probability of a market correction - which could coincide with my theoretical pull back from that first target. Another interesting aspect of TLS' chart is that from July 2018 to October 2020 it made a text book Elliott Wave cycle pattern - was it a full price cycle or just Waves 1 & 2 of a larger cycle? I'm not sure but I'd opt for the second alternative which would mean price is on the stongest rising wave (Wave3) in a price cycle. If I'm wrong and the 2020 low is the start of a new price cycle then the recent rise is Wave 1 which could be expected to fall back close to the 2020 low. While this sounds like the 'it could go up, or it could go down" analysis, you always need to consider alternative outlooks in charting or you risk severely toasting ones privates!
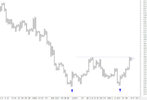
Lastly, TLS made a double bottom (some might say triple) and it would seem the strong rise that pattern predicts has been fulfilled - but perhaps it has a long way to go yet.
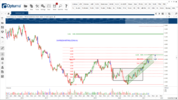
Lastly, TLS made a double bottom (some might say triple) and it would seem the strong rise that pattern predicts has been fulfilled - but perhaps it has a long way to go yet.


