- Joined
- 19 August 2021
- Posts
- 249
- Reactions
- 736
I’ve been watching PNV recently because it has fallen to a point that could be a turning point. For those not into charting don’t bother reading on as it is largely musing about what various theories suggest for PNV’s short term outlook.
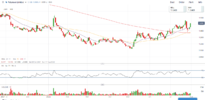
Is it a buy for me? Not yet as it has been in a technical weekly downtrend since the start of this year and while downtrends don’t last forever, they suggest further falls are more likely than the alternative. Price needs to break above the downtrend line on the chart to change this outlook.
There is a strong level of resistance at $2.04 that price recently bounced off. If price moves back down to break this level, further falls could be expected. The next stop down (and one that has some analysis that suggests it is the bottom) is $1.75. This level is a 161.8% Fibonacci retracement of what I see as possibly Wave B (Elliott Wave Theory).
One worrying aspect of the chart (were I a holder) would be that price has made a lower weekly peak followed by a lower trough this week. These are only small moves but a sign of weakness nevertheless.
There are suggestions that the $2.04 low will hold in that the blue dashed line is a line of support that has held under price for 3 years. The probability that this support will be broken isn’t good (except for those who bought on the bounce). Interestingly, if price did fall through $2.04 with any volume then that would give a target of $1.76 for a short term fall.
The red dashed horizontal lines are calculated levels of natural support and resistance.
Summary: PNV’s current fall may have ended but support for that view is not as strong as a further fall to $1.75
And remember, the above is just theory, not a prediction of an outcome – just an educated guess based on chart patterns.

