Australian (ASX) Stock Market Forum

Palladium

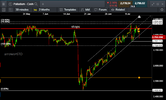
price has extended in a tight channel, i think we are stretched here, in the sell again
a confirmation on a break of the channel,
stop 2886
 
firmly out of the channel https://www.tradingview.com/x/Y8OVwr04/

there's a long way to go before calling anything significant about trend, directly below the base of the larger upwards channel
see 2400, there's a thick band of vpoc "support" starts 2470's, plenty of swings, we're halfway within the channel, this morning
currently a healthy snap back

sells hold for mine until a rotation signal appears
 
same distribution signal as xauusd
not big, maybe coincidental, same players balancing books maybe
employment #'s due
adds to my sells
 
since the high price has met same-stage retracement ratios
we are out of a minor channel
sellside suits mine todate unless 2853's get snapped
 
$pa $palladium provided a very clean set of ratios this morning at the low
also providing clear risk level, now with the bid
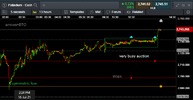
this afternoon aest the auction was very busy
palladium finds its low 160721.png
 
#set-up
in terms of risk, this was a very good set-up in that structurally there are 3 different technical aspects:
1 the repetition of price reaching and being rejected at bounce-high ratios (typically 76.4, 78.6 and 88.6)
2 broken channel with failed attempt to re-enter
3 breakdown of a high win-rate triangle (a break out and thrust in the wrong direction v. expectation)
i have not labelled the triangle (as applicable in the EWP regime) simply drawing the boundaries in this instance is sufficient

"a very busy auction" = claxon

of course i did take a long expecting the triangle to resolve with a small higher high
and that higher high would been the final move that would have disrupted the series of ratios
....structurally, given the auction sudden turnover we should consider
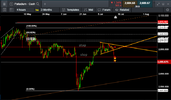
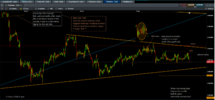
the larger upwards channel base from Aug 2018 is about to be tested,
any break and a failed back test is likely to attract a swift transaction
 
Not going to reflect well in the Chalice Mining (CHN) chart on Monday I suspect
 
STO closed, we do not appear to want to test the lower boundary of the larger upwards channel
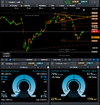
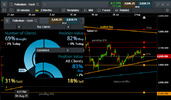
strangely tho as the sentiment is (71% BTO top clients, 80% BTO retail cfd's)
...a tad bullish for the bottom of a sell phase

pending STO at 2558
keeping inline with previous ratios price would need to ascend the 88.6% 2837's to confirm there's a new altime coming
 
palladium 81 percenters 220721.png

when central banks roamed the earth (Neo-Bankasaurusscoming)
and no one knew the definition of fear (Anthro-Herded)......
 
slumping, back with the offer this morning, protecting 2731 front month
a lot m/a crossover trades will be getting applied hourly/daily basis,
$xauusd also slumping
PM's lacking bids price accepting lower offers
 
lots of happy faces hitting the buy button in a place that would normally show fear
..still liking the sellside based on above posts
using the "position value and number of clients" is harder to read with thin trade, there's enough consistency to suggest
palladium low hanging fruit 040821.png
 
scratched my head, invented dandruff! (great name for a jazz trio)

at the bottom of a decent % sell-down, is it not odd, sentiment is so bullish ?
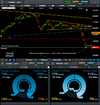
palladium uber bulls wrong trousers 200821.png

"...it's the wrong trousers, Gromit" ?
 
for the sake of follow-thru, i'll keep posting in this,
there has been no reason to change the sell perspective
each step along the way has better suited the sell side, including all the countertrent moves which,
todate, have been measured,
meaning, they respected ratios, swings against the decline have only once had an impulsive construct,
a last gasp to get the uptrend back on

the sentiment on friday ran at 80-90% buyside, meaning, a lot butchers gloves were also purchased (= 10 to 20% sell to open)

saturday morning price closed right on an intermediate channel floor, odds of a gap-thru are good, but, games being games we could find a
rip north to test commitment, likely friday sellers withdraw and ask for higher prices, some covering and more BTFD from retail

3 charts: close up, 4 hourly, daily

15m https://www.tradingview.com/x/Nyyy4VBl/

240min https://www.tradingview.com/x/RJ2NeiXV/

24hr https://www.tradingview.com/x/RF3TbxLO/
 
Top