Australian (ASX) Stock Market Forum

Sure thing @Skate -- I'll post up the sim results for the parameters you've specified. I'll post them up later tonight. No it's not Radge's WTT, it's my take on the common RSI/MA based swing which I've been live trading for almost 2 years now and yes I coded it in AB (sorry I know my RSI/MA post is a bit off topic for this thread but was just responding to TraderJimmy's question). I've been live trading my modified version of Radge's WTT since 2015 so I'll put those sim results up as well, but that will have to wait until tomorrow.

@MovingAverage WOW, that is a generous offer to post captures of both strategies.

Another minor request
Is it possible to post the captures in the "Dump it here" thread as the subject matter is in line with the current theme of posts.

I'm always after educational posts
Posting captures of your RSI/MA Strategy & your modified Radge WTT Strategy would make for the ideal post as most readers are interested in how & what others are trading. When members formulate their own strategy it tends to motivate others to do the same.

Thank you.

Skate.

No problems....I use Stator to track my live trades so I'll do a performance dump from Stator so you can see the live trades as well.
 
It would be even better if you would change your parameters to match the ones below
Backtest period = 1st January 2020 to 30th June 2020
Portfolio Size = $300K
Number of positions = 20
Skate.

Hi,
WTT coded by myself, reviewed by another online friend, but please take it with a grain of salt.
Btw this is the US market, Russell 3000.

The results are highly sensitive to the ranking algorithm. The WTT book didn't provide a ranking algorithm, but random is not a choice.

  • Ranking by ROC, you'd lose, Net profit % = -16.59%
  • Ranking by BFB of last 52 weeks (bank for the buck, highest volatile stocks), Net profit % = 16.48%.

Holly molly, simply changing the ranking formula changes the results by a lot. This is actually my beef with the system, it seems light in parameters but slightly changing 1 parameter you get much different results. E.g. changing the index filter from 10 weeks to 15 weeks the above profit turns to a negative -2.25%. I mention the 15 weeks because 2 years ago I was running multiple backtests from 1990 up to 2 years ago and 15 weeks managed to avoid some fake bear markets and stayed invested. Now fast forward 2 years and 15 weeks index filter crashed and burned this year.

I know that you can't have the cake and eat it too, but every time I get interested into this system I found the general performance since 2013 not better than simply investing directly into the index (SPX or Russell 3000).

Hope it helps.

EDIT: I see you guys are talking about australian market. I've done no backtest on AU data, but judging from Nick's WTT turnkey code page it looks like it's more profitable than US.
 
The results are highly sensitive to the ranking algorithm. The WTT book didn't provide a ranking algorithm, but random is not a choice.

  • Ranking by ROC, you'd lose, Net profit % = -16.59%
  • Ranking by BFB of last 52 weeks (bank for the buck, highest volatile stocks), Net profit % = 16.48%.
This is very very interesting! Bang for buck using the 52-week ATR is the ranking system I use for my superannuation system. I was never a fan of using ROC % as a ranking indicator. To me, it always seemed as though ROC ranking would get you into stocks with pre existing, big established trends, and filter the base breakouts in low $ value stocks to the bottom of the list. This is what would have happened this week to GXY even though its potential weekly return is 3rd highest. This is no issue when you are originally establishing a portfolio because you buy everything that meets your entry criteria until the portfolio is full. But, once the portfolio is established and you only have 1 or 2 spaces to fill in the portfolio, especially when you are not trading a $300,000 account (used for all the backtests I have seen on here recently), you might unintentionally filter out the most profitable stocks due to a ranking system that prioritises past price movement over possible weekly returns.

Ranking using ROC %

ROC %.JPG

Ranking using Bang for Buck

Possible Weekly Return.JPG
 
Hi,
WTT coded by myself, reviewed by another online friend, but please take it with a grain of salt. I know that you can't have the cake and eat it too, but every time I get interested into this system I found the general performance since 2013 not better than simply investing directly into the index (SPX or Russell 3000).
Hope it helps.

@soso your post helps immensely as it's given me an idea
For those interested, I'll explain my methodology of constructing a strategy for a beginner to follow along. I'll construct the strategy in such a way so it can be used as a "template" for other trading ideas. In the series of posts, I'll construct the WTT strategy as there is renewed interest.

In the "Dump it here" thread
1. I'll make a series of post about strategy construction in Amibroker
2. I'll explain what Amiboker is in plain English & some keywords
3. I'll do a step-through, a "storyboard" a step-by-step construction of a basic WTT strategy
4. When finished the WTT Strategy will be tradable if you have "Amibroker + a Data supply"
5. I'll make sure the series of posts are understandable even for a beginner to follow
6. I'll make "the series" before posting them & in doing so the series might stay together without interuption

Skate.
 
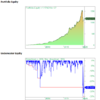
@TraderJimmy here you go. I've just done a quick backtest in Ami to give you a general feel for the performance of my swing system. Remember, this is just a single run and the system performance will vary depending on the combination of trades taken (I prefer to look at a bunch of different simulations through Monte Carlo to get a better understanding of how a system is likely to behave). I've just run this on All Ords constituents between 1/1/2000 through to today.These sims are backtested on a simple position size approach of each position being 20% of portfolio value so max of 5 concurrent open positions. In summary, system has high win rate of around 65%, has average hold time of 4 days, frequent trades for small average profit of around 4% on winning trades.

View attachment 107228 View attachment 107229 View attachment 107230 View attachment 107232

Your results are interesting MA, it sounds like your system is very similar to the one I trade. I have a trading mine from around 2016. I use 10 positions at 10% tho not five. I also have about three different entries depending on the current market conditions. The charts below are from my latest version that I tweaked after the initial covid crash, my exit was too slow in the freefalling market. I will add a chart of my initial version after.

upload_2020-8-11_14-12-37.png

upload_2020-8-11_14-13-27.png
 
Your results are interesting MA, it sounds like your system is very similar to the one I trade. I have a trading mine from around 2016. I use 10 positions at 10% tho not five. I also have about three different entries depending on the current market conditions. The charts below are from my latest version that I tweaked after the initial covid crash, my exit was too slow in the freefalling market. I will add a chart of my initial version after.

View attachment 107327

View attachment 107328
This is before i tweaked my exit, i stopped trading around a 20% dd. Still hurts but good lesson. Trading my tweaked system now

upload_2020-8-11_14-27-0.png
 
Your results are interesting MA, it sounds like your system is very similar to the one I trade. I have a trading mine from around 2016. I use 10 positions at 10% tho not five. I also have about three different entries depending on the current market conditions. The charts below are from my latest version that I tweaked after the initial covid crash, my exit was too slow in the freefalling market. I will add a chart of my initial version after.

View attachment 107327

View attachment 107328

Thanks for the post @Roller_1. Yes, we seem to have similar stats. Mine definitely has a higher Avg, Profit/Loss % but I think that is probably down to my more aggressive position sizing--your 10% v. my 20%. The big difference I can see between your performance and my performance is the consecutive winners/losers ratio--my system runs at a ratio of a little over 3:1 (3 winners for 1 loser). Your sims have your system running at around 1.5:1. You seem to have a shorter hold time than mine, which is good. By the look of that equity curve you're not running an index filter either? Your three different entries sounds interesting...care to share any high-level insight into your entries?
 
Thanks for the post @Roller_1. Yes, we seem to have similar stats. Mine definitely has a higher Avg, Profit/Loss % but I think that is probably down to my more aggressive position sizing--your 10% v. my 20%. The big difference I can see between your performance and my performance is the consecutive winners/losers ratio--my system runs at a ratio of a little over 3:1 (3 winners for 1 loser). Your sims have your system running at around 1.5:1. You seem to have a shorter hold time than mine, which is good. By the look of that equity curve you're not running an index filter either? Your three different entries sounds interesting...care to share any high-level insight into your entries?

I don't use a index filter to switch off my system, I use one to switch between entry signals. When the market is trending up I want to be involved as much as possible (it still doesn't seem enough in times like now) so I will take any one of the three entries. When the market turns down and my index filter switches on I only want to take the best entries. I found that this was a good way to help reduce drawdown while still being involved in a down trending market. The entries aren't anything special just trying to identify when price is extended to the downside to find swing backup.

The shorter holding period is a product of the different exit. I was using a close above a moving average but when price got too far below after a steep drop it was hard to get price back above before my n-bar exit got hit.

Where abouts do you get that ratio from?

Are you using limit orders to enter the market? If so do you have much trouble with missing trades?

Cheers.
 
Where abouts do you get that ratio from?

Are you using limit orders to enter the market? If so do you have much trouble with missing trades?

Cheers.

Re the ratio: from your results you show Max. Consecutive winners of 21 and Max Consecutive losers of 13, which in round figures is 1.5 winners to 1 loser. While not shown in my post my sims has my Max. Consecutive winners at 25 and Max. Consecutive losers at around 5 giving me a 3 to 1 ratio. Yes I do use limit orders and yes I miss trades especially in the current volatile (up one day down the next day) environment. It is early days yet but I'm pretty certain I can improve on that by setting my entry condition (limit price) based on ATR of the index. I've done some preliminary sims and they are looking promising--early results showing an increase of 15% to 20% of entered trades. Partial fills can be an issue to.
 
Re the ratio: from your results you show Max. Consecutive winners of 21 and Max Consecutive losers of 13, which in round figures is 1.5 winners to 1 loser. While not shown in my post my sims has my Max. Consecutive winners at 25 and Max. Consecutive losers at around 5 giving me a 3 to 1 ratio. Yes I do use limit orders and yes I miss trades especially in the current volatile (up one day down the next day) environment. It is early days yet but I'm pretty certain I can improve on that by setting my entry condition (limit price) based on ATR of the index. I've done some preliminary sims and they are looking promising--early results showing an increase of 15% to 20% of entered trades. Partial fills can be an issue to.

Oh yeh got it.

I only tend to miss trades when the L = my limit price, they're always the best ones too. Will you still account for each symbols volatility with the ATR calculation?
 
Top