Australian (ASX) Stock Market Forum

Nasdaq

Joined
25 December 2018
Posts
258
Reactions
232
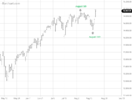
Nasdaq could possibly top into the 6th July . 7 squares up from 13002 Low equals 14645 and 9 squares up from 12553 low equals 14650 . Price and Time have balanced at 30 points per degree and the 6th July is 120 degrees in time from the 5th March Low . The two prices I am looking at are 14655 * and 14643 so will watch on a smaller time frame to see how price reacts around these levels .
Student of Gann at twitter .
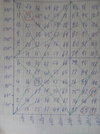
 
Have recently been working out some Cycles for this market . Reasonable selloff last night may indicate further downside . Here is a recent Forecast from my Twitter account.

Forecast Issued 18th July 5.52pm 18 days ago.

Nasdaq Curve called for a Top on the 4th August with trend down to the 23rd August. Current Top at 5th August seems to be holding with next Low indicated for the 16th August which is an adjustment to the original forecast.
 

Attachments

  • IMG_20210811_130313.jpg
    IMG_20210811_130313.jpg
    274.9 KB · Views: 56
Nasdaq moving in line with the Forecast issued 18th July calling Top for 5th August .

So far we are off about 380 points .
Low was indicated for around 16th August which has been exceeded . I have prepared two Curves which could indicate future direction . There are two scenarios that could play out so I will be watching the next few sessions closely .
 

Attachments

  • IMG_20210819_110908.jpg
    IMG_20210819_110908.jpg
    254.1 KB · Views: 25
Nasdaq Roadmap out.
If the 27th August turns out to be Low we could be running against this Curve. Price action into this date should provide confirmation on whether the Cycle is correct.
My initial forecast issued more than a month ago indicated Low for August 24th but after a careful revision I have wound that date out to the 27th August .
 

Attachments

  • IMG_20210820_163149.jpg
    IMG_20210820_163149.jpg
    162.2 KB · Views: 18
  • IMG_20210820_163309.jpg
    IMG_20210820_163309.jpg
    391.1 KB · Views: 14
Looks like 23rd - 24th August could be Main Top for Nasdaq and possibly SP500 . I called the 23rd August as a significant turning point on the 14th August but wasn't sure at that point whether it would Top or Bottom .
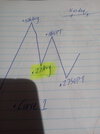
In this regard I prepared two Curves which outlined possible direction into these dates . Following the 5th August High being taken out it now looks like we are running against Curve 2 which called Top for 23rd August so now we are in the target zone.
Price targets for both indexes are listed on my Twitter account.
 

Attachments

  • 16297705708712036101304127806518.jpg
    16297705708712036101304127806518.jpg
    224.4 KB · Views: 11
  • 16297706159904075262124427777309.jpg
    16297706159904075262124427777309.jpg
    288.7 KB · Views: 19
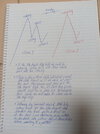
Here is a review of my Forecast calling Nasdaq Top for the 4th August .This Curve was posted on my Twitter account on the 18th July almost three weeks in advance . Main Top was called for the 4th August with price down to around 23rd August . Actual Result was Top August 5th and price down to the 19th August so the Low came in two days later than the Forecast with the price down around 472 points which didn't quite match the amplitude of the original Forecast however the Timing Dates were accurate .
Here is a copy of the original the original Forecast against the market.
Student of Gann at twitter
 

Attachments

  • golll.png
    golll.png
    35 KB · Views: 28
  • correct1.jpeg
    correct1.jpeg
    199 KB · Views: 27
The NASDAQ is gonna get hammered tonight. Hoo boy! Those Facebook results has set off what looks to be a huge selloff of tech stocks. Things are gonna get ugly. Zuck is gonna lose a fortune on paper.

nasdaq030222.png


zuck.jpg
 
Nearly -2.8%;
While the focus is on FB..aka meta..(for real???) Anyway ..
->There are quite a few other disappointing results in the tech space..overall not flashy at all and the BCE saying end of free money does not help a sector which is a giant air balloon
 
What Happened in the Market Last Week?

Market volatility picked up again last week after the Bank of England said it will end its bond buying on Friday as planned, the IMF cut global growth forecasts, and inflation data suggested rate hikes are set to continue.

It seems there are few places to hide as the Nasdaq index hit 2 year lows, and the technology, telecoms, and real estate sectors fell to new 52-week lows. Bond yields also traded up to levels last seen more than ten years ago, as selling continued.
 
Top