Australian (ASX) Stock Market Forum

Market Capitalisation / GDP thread

Joined
6 September 2016
Posts
1,260
Reactions
1,596
I posted a few times the market cap/gdp ratio charts in another thread but I figured might as well start a new one.

Data sources:
GuruFocus has their own page on this and use their own methodology which you can compare against https://www.gurufocus.com/global-market-valuation.php?country=AUS

To be clear
Valuations are not a market timing tool.
Valuations don't provide good info on the path of future short/medium term (1-3y) returns.
Valuations tend to be very good at providing info on path of future long term (5-12y) returns.
Just because valuations are cheap does not mean they cannot get cheaper in the short/medium term.
Just because valuations are expensive does not mean they cannot get more expensive in the short/medium term.
Total Market Cap/GDP is just one of many valuation ratios which are really just a short-hand way to express the present value of future cash flows.


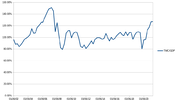
Using the most recent released numbers of Sep 2020 Market Cap and Sep 2020 GDP we are at ~100 TMC/GDP:

1608590800938.png

According to the Nov 2020 RBA Statement on Monetary Policy they forecast Dec 2020 GDP to be a -4% YoY from Dec 2019:
https://www.rba.gov.au/publications/smp/2020/nov/economic-outlook.html (see Table 6.1)

So using 0.96*Dec 2019 GDP and Nov 2020 Market Cap to impute a Dec 2020 forecast for TMC/GDP puts us at ~113% TMC/GDP, in line with GuruFocus numbers.

1608595223889.png

This is just a forecast for that value and we won't know for sure until Dec 2020 GDP and TMC numbers are released, but probably pretty close.

Which means we have gone from valuations in March equal to the 2002, 2008, 2011 bottoms (cheap and associated with strong forward long term returns) to valuations today equal to 2007 (expensive and associated with weak forward long term returns).

GuruFocus currently has their TMC/GDP at ~113%, so make of that what you will.
 
Last edited by a moderator:
Here's an update on this chart, nobody cared last time but might as well keep it updated every now and then.

This is current up to the September Total Market Cap and I am using the RBA forecast of -3% YoY GDP decline (https://www.theguardian.com/busines...d-to-have-shrunk-about-3-in-september-quarter) for Sept GDP to get the current TMC/GDP of 127%.

We haven't moved much price wise since Sep so TMC is probably accurate for today too. Actual GDP vs forecast might push this up or down but probably not by too much.

GuruFocus has it at 123% based on their own methodology: https://www.gurufocus.com/global-market-valuation.php?country=AUS (they only use ASX200 market cap).

We last reached these valuations in mid '06, make of that what you will.

Screenshot_2021-11-17_18-16-48.png
 
Sometimes I think media is a bit too pessimistic when writing about these types of estimates.

Yes, I know the media employs professional economists, and I'm just an old retired fuddy duddy, but the latest RBA estimates (on this page) say that Australia will have 3% GDP growth for the year to December 2021, followed by a booming calendar year 2022.

For the two quarters to June 2021, the ABS (on this page) says that we've had 1.9% and 0.7% GDP growth. That leaves us a little bit of wiggle room to get to the RBA's estimate of 3% for this calendar year.

I'm still in the RBA camp when it comes to this matter. Apart from travel, employment and supply chain worries, our economy appears to be moving ahead quite rapidly now that the populous parts of the country are preparing for a full cut of lockdown rules. I wouldn't be surprised if it is a bumper Christmas, followed by a summer and autumn where Australians are getting out there and spending more and more, generating this demand / production the RBA is expecting in the next 18 months.

KH
 
Updating the thread nobody cares about with just release June GDP and June TMC. Use your imagination for where we are today with the market ~4.5% higher than June close :D

1662522348284.png
 
one problem with GDP ( including in some places outside Australia ) is the basis on which it is calculated ( compared to say 50 years ago )

i am NOT saying the data is irrelevant , but i wish they wouldn't tweak normally boring data for political expediency

i would be nice to compare apples with apples for a change .

cheers

For the purposes of this thread, it's not relevant. In this context, GDP is merely a "sufficient statistic" for cashflows. I don't have access to index weighted XAO revenues going back to '02 but I do have GDP.

The main thing to remember is that a valuation multiple is nothing but shorthand for a proper analysis of long-term discounted cash flows. Whatever the fundamental one uses in a valuation ratio, one should have reasonable confidence that it behaves as a “sufficient statistic” for the very, very long-term cash flows that investors can expect to be delivered into their hands over time.
 
Sometimes I think media is a bit too pessimistic when writing about these types of estimates.

Yes, I know the media employs professional economists, and I'm just an old retired fuddy duddy, but the latest RBA estimates (on this page) say that Australia will have 3% GDP growth for the year to December 2021, followed by a booming calendar year 2022.

For the two quarters to June 2021, the ABS (on this page) says that we've had 1.9% and 0.7% GDP growth. That leaves us a little bit of wiggle room to get to the RBA's estimate of 3% for this calendar year.

I'm still in the RBA camp when it comes to this matter. Apart from travel, employment and supply chain worries, our economy appears to be moving ahead quite rapidly now that the populous parts of the country are preparing for a full cut of lockdown rules. I wouldn't be surprised if it is a bumper Christmas, followed by a summer and autumn where Australians are getting out there and spending more and more, generating this demand / production the RBA is expecting in the next 18 months.

KH
Did I really write this, almost a year ago. Must have polished the crystal ball that week.

KH
 
GDP for Dec came out today, let's update the chart, also using Dec TMC:
1677667587837.png

We're probably at something like 105% now after the January run and assuming no change in GDP.

GuruFocus has us at something like 103% so pretty close to my data.

The long term average of my entire dataset is 102% so if you consider the average to be "fair value" then we're something like fair value.

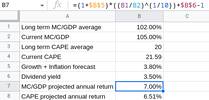
If you assume:
  • the 10Y Aus Gov bond yield of 3.8% is a decent proxy for long run nominal annual XAO EPS growth (i.e. including inflation)
  • the forward dividend yield (not including franking) is something like 3.5%
  • no mean reversion to the valuation multiple because we are approximately at the mean already
then you can shorthand forecast long run forward nominal annual returns for XAO as something like 7%p.a.

This is approximately corroborated by another model using CAPE ratio instead of TMC/GDP which has 6.5%p.a.

1677668655757.png
 
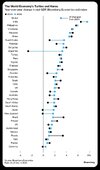
Research Affiliates out spruiking their new tools in a newsletter today, showing 10%+p.a returns for Aus using a similar model to mine above, mine is more conservative but there you go.

h/t Research Affiliates

Dev-capital-market-insights-returns-EMAIL-v2.png
 
23Q1 GDP figures released recently (by gosh our data frequency in Aus is so poor compared to the US), took a chance to revisit the valuation spreadsheet.

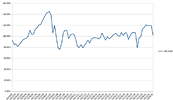
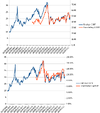
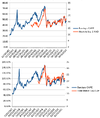
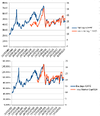
Took the opportunity to add another metric to the valuation toolbox while I was in there, dividing the price of XAO by ABS wage price index, i.e. how many hours would it take in any given quarter to buy 1 XAO, going back to late 1997.

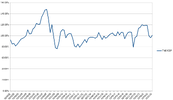
Plotted here against the longest data series I have, Barclays CAPE (thankyou to Barclays for putting this on the net https://indices.cib.barclays/IM/21/en/indices/static/historic-cape.app) going back to 1982.

Wanted to put all 3 in one graph but all of my sheet software only supports dual axis :(

...either way you can see the correlation is pretty good although CAPE got much higher in the Asian boom vs XAO/WPI where they both went up a lot in the pre-GFC commodity/mining boom.

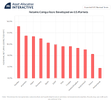
At its peak in '07 it was nearly 70 hours to buy 1 XAO vs the long term average of 46.

1686746801737.png

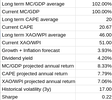
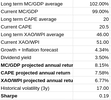
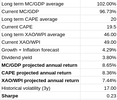
The high correlation between all 3 hopefully helps to corroborate the story each is telling (3 different numerators with 3 different denominators), 7-8% p.a. expected returns based on assumed nominal EPS growth of ~4%, a 4% dividend yield and fair value pricing at the median multiple.

Sounds good but keep in mind with a historical volatility of 17 and risk free rate at around 4%, the Sharpe ratio is only a miserly 0.2.

1686747107824.png
 
23Q2 GDP figures as well as WPI updates providing some valuation datapoint updates

1695791520934.png

The quarterly figures for GDP and WPI are obviously very lagging, with the data for June quarter only being just released, I always take care to compare those values against the corresponding correct timeseries values for Market Cap and XAO, but if you make some guesses for the current values of GDP and WPI you impute some current values....while the market is in the range it's been in, not much difference in values for XAO or Market Cap relative to June 2023 so current imputed values are probably quite close to June values.

The CAPE value from Barclays is also much higher frequency providing updates at the end of each month

1695791691157.png
 
23Q3 GDP figures out today, took the opportunity to update the spreadsheet

1701845449341.png

1701845597231.png

Obviously this data is from September. Current CAPE is around 19.5 as of end of November for reference.
 
Top