Learning to trade
- Thread starter DaveTrade
- Start date
-
- Tags
- learn to trade
- Joined
- 25 July 2021
- Posts
- 910
- Reactions
- 2,327
This is very easy to code in my software and I would do it for you and post it if I had asx data, but I only have NYSE data. There would be a number of software platforms out there that would let you create custom filters and scans, hopefully someone that knows of a free or inexpensive platform that can do the job will read your post. The software that I use is called 'Trade Navigator'.How can I scan for/find asx stocks where 50dma has crossed above 100dma along with having made a "60 day high price" ?
Am keen to know if there is any software that can scan those specific parameters/filters across the ASX please ?
- Joined
- 14 October 2017
- Posts
- 240
- Reactions
- 327
@Telamelo I think most charting software easily does that
Amibroker would require programming or code downloaded.
Incredible chart I believe does without coding, just pick the boxes.
30 day free trial, then I think $10 a month for data and software use. You can use it for free but can't screen stocks without
Amibroker would require programming or code downloaded.
Incredible chart I believe does without coding, just pick the boxes.
30 day free trial, then I think $10 a month for data and software use. You can use it for free but can't screen stocks without
A big thanks to both of you @DaveTrade & @Austwide for your feedback/suggestions as I'll check it out.@Telamelo I think most charting software easily does that
Amibroker would require programming or code downloaded.
Incredible chart I believe does without coding, just pick the boxes.
30 day free trial, then I think $10 a month for data and software use. You can use it for free but can't screen stocks without
Also advised/told Metastock can do this as well but it's a bit too pricey for my liking.
Cheers tela
- Joined
- 21 August 2008
- Posts
- 2,845
- Reactions
- 8,830
How can I scan for/find asx stocks where 50dma has crossed above 100dma along with having made a "60 day high price" ?
Am keen to know if there is any software that can scan those specific parameters/filters across the ASX please ?
@Telamelo I think most charting software easily does that
Amibroker would require programming or code downloaded.
Incredible chart I believe does without coding, just pick the boxes.
30 day free trial, then I think $10 a month for data and software use. You can use it for free but can't screen stocks without
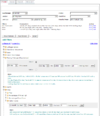
The Stock Screen Section of Incredible Charts it has its limitations.
As for moving average scans you are limited to Exponential MAs, that’s it, but you can scan for 50d > 100d EMA.
For the 60 day high Price – the closest choice is a 55 day New High or it has a 3 month (63 day) New High
** Scanned for the 50 day > 100 day EMA and the 55 day New High price within the last 1 trading day for the XAO market and it returned 99 stocks to view.
** Scanned for the 50 day > 100 day EMA and the 3 month (63 day) 55 day New High price within the last 1 trading day for the XAO market and it returned 97 stocks to view.
So nearly the same, not surprising as the scan is fairly close.
- Joined
- 25 July 2021
- Posts
- 910
- Reactions
- 2,327
I came across this article from Netpicks and thought it would be a good one to throw in here;

How to Trade ABCD Pattern: Simple Strategy for Beginners
The ABCD harmonic pattern is an important pattern in stock and options trading that can provide traders with greater insight into market movements and potential entry points for trades. But what is it, why should you use it, and how do you go about trading with it?
In this post, we’ll answer these questions by exploring the significance of the ABCD trading pattern, as well as a simple strategy that incorporates moving averages with the pattern.
Traders use this pattern to determine whether prices are likely to form a bearish or bullish reversal. The key components that make up this pattern are:
• Point A – This represents where the pattern begins and a trader should start looking for an ABCD formation
• Point B – This indicates either a peak or trough in prices depending on the direction of A
• Point C – This shows where the counter trend move has ended
• Point D – This denotes when an ABCD formation has been completed
When all four points have been identified, traders can then look at how far apart each point is from one another using the Fibonacci ratios 0.618 (62%) and 127.2%-161.8%. These numbers represent how much retracement there will be between two points before prices reverse.
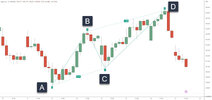
To have a valid ABCD pattern (Classic ABCD pattern), all four points must line up correctly according to these ratios (close is close enough).
The ABCD Harmonic Pattern is a powerful pattern for traders to identify potential reversals and trend continuations, making it an invaluable addition to any trading strategy.
Main Lesson: The ABCD harmonic pattern is a price pattern used by traders to identify potential price movements in the stock market, based on Fibonacci ratios and four key points.
Traders can also use this pattern to identify potential support and resistance levels which can be used to set stop losses or take profits. For example, if a trader identifies that price has reached a certain level (point C) then they may decide to place a stop loss order below that level so that if price falls further, their position can be closed.
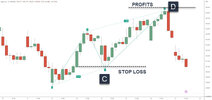
If price reaches another level (point D) then they may decide to take profits by closing their position.
Traders can also use this pattern to identify trends in an instrument.
If there is downtrend present then traders may look for opportunities where prices have retreated from point D yet remain below point C – suggesting that the move still has some downside potential. This is a price action trending structure of lower highs and lower lows.
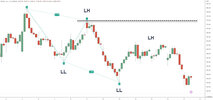
A bullish ABCD pattern is traded in the opposite way. You would be looking for any break below the C leg of the pattern.
By understanding how this harmonic pattern works and what it indicates about current market conditions and trends, traders are better equipped to make informed trading decisions.
Main Lesson: The ABCD pattern provides traders with valuable information to help them identify potential entry and exit points, support and resistance levels, as well as trends in the stock or options market.
The ABCD chart pattern is no exception. While the ideal pattern uses the ratios, simplest harmonic pattern is using the AB=CD chart pattern and is how I use it.
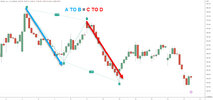
On the price chart above, we are looking at market direction to the downside. The pattern begins with a move down and finds support. This is our A-B leg of the move. We look for a rally in price and once price begins to break down, we are looking for the C-D leg with the profit target at the end of that move (the end of the red arrow).
We are looking for equivalent price legs and often times, that is what we actually get.
At the end of the move, we expect it to act as a reversal pattern and we either take profits or be aggressive with our stop loss.
Main Lesson: Chart patterns do not have to fit into a rigid definition. Instead of using Fib ratios, we look for the second leg of the move to be roughly equal to the first.
To identify trading opportunities, we will look for price to be near a long-term moving average (MA) line such as 50-day. We look for a leg up in price to identify the peak of the current market direction.
On this chart, we see price above the moving average and a gap up in price shows traders aggressively buying. We can easily plot the A-B move and we wait until we get the pullback. The end of that pullback is the start of our C-D leg and where we look for a trade entry.
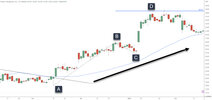
Once in the trade, you measure the move from A-B and project from C. Some traders would place a sell order at D to exit the trade automatically. Other traders may sell half of their position at the 50% point of the C-D move.
Stop loss can go under the low at C.
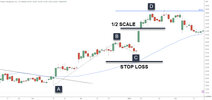
When using moving averages as part of your trading strategy with the ABCD pattern, choose one that fits your timeframe and risk tolerance level. If you prefer shorter term trades if you are day trading, then a 10-day or 20-day MA may be more suitable than longer term ones like 50-day or 200-day MAs
Swing traders may want to explore everything from the 20 period SMA and upwards.
Once an appropriate MA has been selected and the pattern is visible, traders must decide how to enter their trade in line with their risk tolerance, entry techniques, and how they will take profits.
If an options trader, you may chose to purchase calls or puts with a strike price around the end of the C leg.
Main Lesson: The ABCD harmonic pattern is a powerful trading tool that can be used to identify potential entry and exit points, however traders must take into account market conditions and use proper money management techniques for best results.
While this strategy has proven successful for traders, it should be noted that there are no guarantees when trading stocks or other financial instruments.
The key to success with this pattern is understanding how it works, why it works, and finding the obvious swing points to use. By combining the ABCD pattern with other technical indicators such as moving averages, you can create an effective trading strategy that uses the rhythm of the instrument you are trading.

How to Trade ABCD Pattern: Simple Strategy for Beginners
The ABCD harmonic pattern is an important pattern in stock and options trading that can provide traders with greater insight into market movements and potential entry points for trades. But what is it, why should you use it, and how do you go about trading with it?
In this post, we’ll answer these questions by exploring the significance of the ABCD trading pattern, as well as a simple strategy that incorporates moving averages with the pattern.
What We Will Cover:
- What Is The ABCD Harmonic Pattern?
- Importance of ABCD Pattern
- How Do You Trade With The ABCD Pattern?
- Simple Trading Strategy Using Moving Average & ABCD Pattern
- Conclusion
- FAQs
- Conclusion
What Is The ABCD Harmonic Pattern?
The ABCD harmonic pattern is price pattern that is used by traders to identify potential price movements in the stock market. The original pattern is based on Fibonacci ratios and uses four points, A, B, C and D.Traders use this pattern to determine whether prices are likely to form a bearish or bullish reversal. The key components that make up this pattern are:
• Point A – This represents where the pattern begins and a trader should start looking for an ABCD formation
• Point B – This indicates either a peak or trough in prices depending on the direction of A
• Point C – This shows where the counter trend move has ended
• Point D – This denotes when an ABCD formation has been completed
When all four points have been identified, traders can then look at how far apart each point is from one another using the Fibonacci ratios 0.618 (62%) and 127.2%-161.8%. These numbers represent how much retracement there will be between two points before prices reverse.

To have a valid ABCD pattern (Classic ABCD pattern), all four points must line up correctly according to these ratios (close is close enough).
The ABCD Harmonic Pattern is a powerful pattern for traders to identify potential reversals and trend continuations, making it an invaluable addition to any trading strategy.
Main Lesson: The ABCD harmonic pattern is a price pattern used by traders to identify potential price movements in the stock market, based on Fibonacci ratios and four key points.
Importance of ABCD Pattern
The ABCD pattern can be an important tool for traders as it helps identify potential entry and exit points in an instrument. It can be a reversal pattern at D or a continuation pattern at C depending on the context of price.Traders can also use this pattern to identify potential support and resistance levels which can be used to set stop losses or take profits. For example, if a trader identifies that price has reached a certain level (point C) then they may decide to place a stop loss order below that level so that if price falls further, their position can be closed.

If price reaches another level (point D) then they may decide to take profits by closing their position.
Traders can also use this pattern to identify trends in an instrument.
If there is downtrend present then traders may look for opportunities where prices have retreated from point D yet remain below point C – suggesting that the move still has some downside potential. This is a price action trending structure of lower highs and lower lows.

A bullish ABCD pattern is traded in the opposite way. You would be looking for any break below the C leg of the pattern.
By understanding how this harmonic pattern works and what it indicates about current market conditions and trends, traders are better equipped to make informed trading decisions.
Main Lesson: The ABCD pattern provides traders with valuable information to help them identify potential entry and exit points, support and resistance levels, as well as trends in the stock or options market.
How Do You Trade With The ABCD Pattern?
Now that you know about the classic ABCD pattern, there is a better way to use this pattern. Trading patterns in price is a good approach but they do not have to fit such rigid rules.The ABCD chart pattern is no exception. While the ideal pattern uses the ratios, simplest harmonic pattern is using the AB=CD chart pattern and is how I use it.

On the price chart above, we are looking at market direction to the downside. The pattern begins with a move down and finds support. This is our A-B leg of the move. We look for a rally in price and once price begins to break down, we are looking for the C-D leg with the profit target at the end of that move (the end of the red arrow).
We are looking for equivalent price legs and often times, that is what we actually get.
At the end of the move, we expect it to act as a reversal pattern and we either take profits or be aggressive with our stop loss.
Main Lesson: Chart patterns do not have to fit into a rigid definition. Instead of using Fib ratios, we look for the second leg of the move to be roughly equal to the first.
Simple Trading Strategy Using Moving Average & ABCD Pattern
This strategy works best when there are no major news events that could affect price movements in either direction. For example, if looking for the release of earning reports, we’d wait until the smoke clears before looking to take a trade.To identify trading opportunities, we will look for price to be near a long-term moving average (MA) line such as 50-day. We look for a leg up in price to identify the peak of the current market direction.
On this chart, we see price above the moving average and a gap up in price shows traders aggressively buying. We can easily plot the A-B move and we wait until we get the pullback. The end of that pullback is the start of our C-D leg and where we look for a trade entry.

Once in the trade, you measure the move from A-B and project from C. Some traders would place a sell order at D to exit the trade automatically. Other traders may sell half of their position at the 50% point of the C-D move.
Stop loss can go under the low at C.

When using moving averages as part of your trading strategy with the ABCD pattern, choose one that fits your timeframe and risk tolerance level. If you prefer shorter term trades if you are day trading, then a 10-day or 20-day MA may be more suitable than longer term ones like 50-day or 200-day MAs
Swing traders may want to explore everything from the 20 period SMA and upwards.
Once an appropriate MA has been selected and the pattern is visible, traders must decide how to enter their trade in line with their risk tolerance, entry techniques, and how they will take profits.
If an options trader, you may chose to purchase calls or puts with a strike price around the end of the C leg.
Main Lesson: The ABCD harmonic pattern is a powerful trading tool that can be used to identify potential entry and exit points, however traders must take into account market conditions and use proper money management techniques for best results.
FAQs
Is ABCD pattern good?
It is based on the idea that prices tend to move in repeating patterns over time. The stair stepping pattern consists of higher highs and higher lows (or the opposite) which is what a trending market does.While this strategy has proven successful for traders, it should be noted that there are no guarantees when trading stocks or other financial instruments.
What is an ABCD setup?
Whether you use the specific Fibonacci ratios required for the original pattern or the simplified method, the pattern is the same.. It consists of four price points, A, B, C and D which form a symmetrical pattern. Point A marks the beginning of the trend while point B marks the highest peak or lowest trough in that trend. Point C marks the end of the retracement and point D marks an extension from point C. This setup can be used to find a probable end to the current trend.Conclusion
The ABCD pattern is a powerful pattern for traders of all levels. It can be used to identify potential reversals, entry points, and provide insight into future price movements.The key to success with this pattern is understanding how it works, why it works, and finding the obvious swing points to use. By combining the ABCD pattern with other technical indicators such as moving averages, you can create an effective trading strategy that uses the rhythm of the instrument you are trading.
- Joined
- 25 July 2021
- Posts
- 910
- Reactions
- 2,327
- Joined
- 25 July 2021
- Posts
- 910
- Reactions
- 2,327
Why Good Trading Is Like a Three-Legged Stool
By Imre Gams, analyst, Market Minute
It may seem like I only ever look at price charts. And that I’m strictly a technical trader.
But I use fundamental analysis too.
In fact, fundamental analysis has helped me become the successful trader I am today.
And it can help you too… if you follow this simple process.
Let me explain…
Like most traders, I started my career with fundamental analysis. Because on the surface, it makes sense.
After all, there should be a clear link between a market’s fundamentals and its price. But what appears to be logical, isn’t always true.
You see, if markets consistently followed the fundamentals, there’d be a lot more successful traders and investors out there.
While fundamentals play an important role in my trading, it’s not what you think…
First, understand the distinction between fundamental and technical analysis.
Fundamental analysis will tell you where to look, whereas technical analysis will tell you what to do.
Both methods are complementary to one another.
For example, you may want to trade the currency markets, because there’s always something going on. That’s why I love trading currencies.
Over the years, I’ve gained expertise on broad macroeconomic themes like central bank policies, trade relations, and fiscal policy.
But, you don’t have to be an expert on Norway’s government spending platforms, or New Zealand’s agricultural exports to profit off a move from the Norwegian krone or New Zealand dollar.
All you need to know is whether a big move is on the horizon.
If it is, fundamental analysis can help you know where to get into the market and where to get out.
For instance, if the Reserve Bank of New Zealand (New Zealand’s version of the Fed) has a policy statement coming up, you should know it’s likely a market-moving event.
But knowing whether the central bank will raise rates, lower rates, or keep them the same won’t help you make money.
To make money, you need to know what time the policy statement is scheduled for release. This is how fundamental analysis can tell you where to look. Knowing this, you can then start to work on what to do about it.
That’s where technical analysis comes in. It shows whether you can expect a higher or lower currency move in the aftermath of the news event.
You can analyze the price chart to know where to buy or sell, at which level to set a protective stop loss order, and where to reasonably expect to exit for a nice profit.
So, technical analysis tells me what to do.
Fundamental analysis, technical analysis, and the final part, which we haven’t mentioned yet — strong risk management (we’ll discuss risk management in more detail in another essay). These are the three legs. If you take any one of those legs away, the stool will fall over.
How you use each of those legs is up to you. The way you do it will be different from me… and from most other traders.
See, no two traders are perfectly alike. Jeff Clark trades a little differently from me, and I trade differently from Jeff.
What’s important is to be well-rounded, so you can find your way to profitably trade regardless of what the markets are doing.
Before you place your next trade, think to yourself: Are you using the “three-legged stool” approach?
If not, consider how it could help you increase your profits, reduce your losses, and make trading less stressful overall, thanks to sound risk management.
With the markets moving around as they are right now, this message is more important than ever.
Happy trading,

Imre Gams
Analyst, Market Minute
By Imre Gams, analyst, Market Minute
It may seem like I only ever look at price charts. And that I’m strictly a technical trader.
But I use fundamental analysis too.
In fact, fundamental analysis has helped me become the successful trader I am today.
And it can help you too… if you follow this simple process.
Let me explain…
Like most traders, I started my career with fundamental analysis. Because on the surface, it makes sense.
After all, there should be a clear link between a market’s fundamentals and its price. But what appears to be logical, isn’t always true.
You see, if markets consistently followed the fundamentals, there’d be a lot more successful traders and investors out there.
While fundamentals play an important role in my trading, it’s not what you think…
The Only Way to Trade Markets
There a few key principles to follow if you want to be a successful trader.First, understand the distinction between fundamental and technical analysis.
Fundamental analysis will tell you where to look, whereas technical analysis will tell you what to do.
Both methods are complementary to one another.
For example, you may want to trade the currency markets, because there’s always something going on. That’s why I love trading currencies.
Over the years, I’ve gained expertise on broad macroeconomic themes like central bank policies, trade relations, and fiscal policy.
But, you don’t have to be an expert on Norway’s government spending platforms, or New Zealand’s agricultural exports to profit off a move from the Norwegian krone or New Zealand dollar.
All you need to know is whether a big move is on the horizon.
If it is, fundamental analysis can help you know where to get into the market and where to get out.
For instance, if the Reserve Bank of New Zealand (New Zealand’s version of the Fed) has a policy statement coming up, you should know it’s likely a market-moving event.
But knowing whether the central bank will raise rates, lower rates, or keep them the same won’t help you make money.
To make money, you need to know what time the policy statement is scheduled for release. This is how fundamental analysis can tell you where to look. Knowing this, you can then start to work on what to do about it.
That’s where technical analysis comes in. It shows whether you can expect a higher or lower currency move in the aftermath of the news event.
You can analyze the price chart to know where to buy or sell, at which level to set a protective stop loss order, and where to reasonably expect to exit for a nice profit.
So, technical analysis tells me what to do.
Finding Your Own Way to Profitability
Think of good trading as a three-legged stool…Fundamental analysis, technical analysis, and the final part, which we haven’t mentioned yet — strong risk management (we’ll discuss risk management in more detail in another essay). These are the three legs. If you take any one of those legs away, the stool will fall over.
How you use each of those legs is up to you. The way you do it will be different from me… and from most other traders.
See, no two traders are perfectly alike. Jeff Clark trades a little differently from me, and I trade differently from Jeff.
What’s important is to be well-rounded, so you can find your way to profitably trade regardless of what the markets are doing.
Before you place your next trade, think to yourself: Are you using the “three-legged stool” approach?
If not, consider how it could help you increase your profits, reduce your losses, and make trading less stressful overall, thanks to sound risk management.
With the markets moving around as they are right now, this message is more important than ever.
Happy trading,

Imre Gams
Analyst, Market Minute
- Joined
- 25 July 2021
- Posts
- 910
- Reactions
- 2,327
Know When to Fold
By Brad Hoppmann, analyst, Market Minute
"You've got to know when to hold 'em, know when to fold 'em, know when to walk away, know when to run."
Even though I believe oil prices may retract, the essence of strategic trading lies not just in predicting the market but in knowing when to fold.
While it's possible that oil prices could drop, allowing those positions to become profitable again, betting on such outcomes is speculative.
The courage to fold early, guided by humility and an understanding of market trends, is what differentiates the strategic trader from the gambler.
It's a hard-earned lesson in the importance of protecting your capital for opportunities where the odds are more favorable.
Adopt Stop-Loss Orders: Use them not as a sign of defeat but as a tool of strategic defense.
Assess Risk-Reward Ratios: Always weigh the potential gain against the risk of holding onto a losing position.
Embrace Humility: Let go of ego and greed. Recognize that folding can be a powerful move towards achieving your trading goals.
Reflecting on our recent advice regarding oil, and the broader strategy of folding at the right time, offers a profound lesson.
In trading, as in poker, the wisdom to fold is invaluable. It reflects not just an understanding of the market but a deeper appreciation for the virtues of humility and strategic patience.
Embracing these principles can guide us through the uncertainties of the market, preserving our capital for the moments when the tide turns in our favor.
Regards,
Brad Hoppmann
Analyst, Market Minute
By Brad Hoppmann, analyst, Market Minute
"You've got to know when to hold 'em, know when to fold 'em, know when to walk away, know when to run."
- Kenny Rogers
Just last week, I advised those holding short positions in oil to consider folding if prices climbed above $79 or $80. As oil now hovers above $79, it's a timely reminder of the fine line we walk between strategic foresight and the humility to act on it.Even though I believe oil prices may retract, the essence of strategic trading lies not just in predicting the market but in knowing when to fold.
The Oil Example: A Lesson in Humility
History shows that only a few positions recover from such downturns once you get to a 10% loss. It's a stark reminder that humility and the willingness to accept a smaller loss is not just prudent, it's essential to long-term success.While it's possible that oil prices could drop, allowing those positions to become profitable again, betting on such outcomes is speculative.
Why Folding Early Matters
Accepting a 10% loss rather than risking a 30% loss underscores a vital trading principle: not every loss turns into a gain.The courage to fold early, guided by humility and an understanding of market trends, is what differentiates the strategic trader from the gambler.
It's a hard-earned lesson in the importance of protecting your capital for opportunities where the odds are more favorable.
Implementing Strategic Humility
This approach requires a disciplined mindset:Adopt Stop-Loss Orders: Use them not as a sign of defeat but as a tool of strategic defense.
Assess Risk-Reward Ratios: Always weigh the potential gain against the risk of holding onto a losing position.
Embrace Humility: Let go of ego and greed. Recognize that folding can be a powerful move towards achieving your trading goals.
Reflecting on our recent advice regarding oil, and the broader strategy of folding at the right time, offers a profound lesson.
In trading, as in poker, the wisdom to fold is invaluable. It reflects not just an understanding of the market but a deeper appreciation for the virtues of humility and strategic patience.
Embracing these principles can guide us through the uncertainties of the market, preserving our capital for the moments when the tide turns in our favor.
Regards,
Brad Hoppmann
Analyst, Market Minute
- Joined
- 6 August 2021
- Posts
- 5
- Reactions
- 18
I hope this is the right place to ask this question.
I have just recently joined the forum and started paper trading with a TP I have put together. It is early days but appears to be performing OK.
What I have in the back of my mind is - is this because the overall market is generally rising (since sept) and this makes all TP seem OK.
It would be good to hear how traders on here consider this and what difference it makes to their TP.
In a less favourable market do you :
- do you just take shorter length swing trades on spikes on the down trend with tighter stops
- do you trade less
- are your return targets smaller
- do you consider this at all?
- do you adjust your TP at all?
Note I only currently trade long.
Thanks Darrin
- Joined
- 12 January 2008
- Posts
- 7,540
- Reactions
- 18,927
is this because the overall market is generally rising (since sept) and this makes all TP seem OK.
Yes, absolutely, all long TPs should be earning profits when the market goes up.
You deserve a pat on the back for recognising this, rather than thinking you're a gifted trader.
Knowing this, you should be prepared to risk a little more (start more trades) when the market is going up. Also, use trailing stops not targets to exit as up trends can last a little longer than we think.
In a less favourable market do you :
Trade less, risk less. Accept that the market conditions are unsuitable and wait for the market to go up.
You'll need to have some guidelines (rules) that define the market trend because things get tricky. For example the daily trend may look down but the weekly (larger time frame) trend remains up. What are you going to do? A short term trader will have to wait for the daily trend to turn up, whereas a medium term trader may be looking to buy the dip since the mid term trend (weekly) remains up.
Good luck and be comfortable asking questions.
Value Collector
Have courage, and be kind.
- Joined
- 13 January 2014
- Posts
- 12,281
- Reactions
- 8,555
The ultimate test is are you beating the market averages over time, once you deducted your trading costs and account for the markets dividends.I hope this is the right place to ask this question.
I have just recently joined the forum and started paper trading with a TP I have put together. It is early days but appears to be performing OK.
What I have in the back of my mind is - is this because the overall market is generally rising (since sept) and this makes all TP seem OK.
It would be good to hear how traders on here consider this and what difference it makes to their TP.
In a less favourable market do you :
- do you just take shorter length swing trades on spikes on the down trend with tighter stops
- do you trade less
- are your return targets smaller
- do you consider this at all?
- do you adjust your TP at all?
Note I only currently trade long.
Thanks Darrin
The only reason you should attempt to trade is if you are confident that putting in all that additional effort allows you to beat the market by a substantial amount.
if over time your after fees and taxes your trading profits are lower than what you would have gotten if you just bought and held VAS, then you should probably give up trading and just dollar cost average into the index.
but, if you can go a 5 year period where you out perform VAS (including VAS reinvested dividends), then carry on trading.
A great test would be to put half your money dollar cost averaging into a long term hold through thick and thin into VAS, and the other half into your trading account, and see which performs better.
- Joined
- 25 July 2021
- Posts
- 910
- Reactions
- 2,327
Don’t Forget – Risk Is Earned
By Larry Benedict, editor, Trading with Larry BenedictThe biggest, most important concept in trading is something that’s totally lost on most new traders.
It’s simple. But it’s directly at odds with the “fast cash” mindset that gets most people interested in trading to begin with.
You have to “earn your risk.”
Let me explain…
When folks are new to trading, they tend to look for ludicrous returns right out of the gate. They speculate on long-shot bets and blow away all their starting capital. (I did the same. More on that later…)
I’m not saying there’s no room for those long-shot bets. They can be lucrative, if you have the right plan.
But they have to be earned.
You should only look to place these riskier bets after you’ve captured profits from a number of smaller ones.
You need to grow your capital pile with low-risk trades before you shoot for the moon. That way, you’re protected if the risky trade goes bust… And you’re still around to trade the next day.
That’s what keeps you sustainable.
What tends to happen is a trader will go on a losing streak… get frustrated and emotional… and just wind up losing more, even faster, because they aren’t looking to capture small profits to recover their losses.
I’ve seen it happen with plenty of new traders, all throughout my career. And it’s one of the key factors that drives them out of business.
Only once you’ve built up a strong foundation have you earned the ability to take on more risk. And if you’re on a losing streak, you’ve lost the ability to play with risk.
It’s really that simple.
It Happened to Me, Too
I made my big mistakes early on in my career… And it cost me all of my money several times over.It really came down to a bunch of silly mistakes. One of them was position sizing. I would bet way too much on one risky trade and wipe myself out. After a few times of doing that, I began trading smaller lots.
But once I got further into my career and had a solid foundation of capital, I began to take on larger position sizes.
At first, I was only able to handle 10 shares of stock. Then 100… 1,000… then 10,000.
Soon I was making trades on hundreds of thousands of shares at a time. Then, when I was running my hedge fund, I was trading position sizes in the millions.
That’s because I earned my risk. The lots I was trading grew along with my pile of capital.
You see, I never looked at any position differently. It was the same mentality, no matter the size of the position. I built up my capital base bigger and bigger, and slowly earned the ability to trade more substantial sums.
And that grew my capital pile exponentially…
Here’s an example: One of the larger positions I’ve taken in my career was in Bank of America, in early 2009. This was back when Bank of America was going bankrupt. We were dealing with the financial crisis.
So, I saw an amazing opportunity. I bought $108 million worth of Bank of America in one shot. I went in and got 27 million shares at $4 each – close to the bottom.
I made somewhere between $3 million and $5 million on that trade.
That sounds like a massive return… But it’s actually just about a 4-6% move.
In other words, I took a gain that, in percentage terms, most traders would consider small… but was worth millions.
To build your capital pile, those are precisely the gains you should be looking for on each and every trade. If you’re able to make 3% or 5% several times a week, your trading account will start growing exponentially.
That’s why I don’t get nervous about position sizes. Every position size is basically the same to me. It’s how I’ve done as well as I have.
Bank of America was an outlier, of course. It was a massive position for me. But it was a once-in-a-lifetime opportunity. There was a global financial crisis happening, and I saw the perfect opportunity to trade it.
But I had EARNED that risky trade by slowly building up my capital pile into the hundreds of millions.
Even by starting with just a $100 trading account, you can do the same. It’s all about playing it safe until you earn your risk… and then making that life-changing home run.
Regards,
Larry Benedict
Editor, The Opportunistic Trader
- Joined
- 22 March 2024
- Posts
- 13
- Reactions
- 31
After seeing a couple of people mention starting out learning to trade in their posts, it got me interested in how people start to learn trading these days and what their experiences were. If anyone is willing to share their experience it could be helpful for others.
Thanks @DaveTrade for staring this thread and contributing your time, energy and knowledge. I'm just starting out and this forum has been a huge help so far. My approach over the past couple of months has been to read, which prompts questions, research more to find answers, so on and so forth. Once I've figured out which broker platform / charting software to use, I'll start paper trading and applying principles of fundamental analysis, technical analysis and risk management. I've never known anyone who trades/invests so am using this platform as a form of mentorship. Thanks again, this post is really helpful!
- Joined
- 25 July 2021
- Posts
- 910
- Reactions
- 2,327
Perfect indicator?
That’s what I’d like to cover this month. Is there such a thing as a perfect indicator? And if so… what is it and how do I trade with it? The answer may surprise you. Remember, there are many factors that influence the market and it’s behavior. For now, let’s put news and fundamental analysis aside and focus on market types.There are basically two market types.
First, there are markets that move in a trading range, or that are range bound. The other is markets that are trending. Markets that are making strong moves to the upside or downside.
The astute trader quickly recognizes that no one indicator will work in both types of markets. But there are indicators that work in each type of market very well. The trouble many inexperienced trader faces is when they try to force their “favorite” indicator to work in both market types.
Since there are two types of markets, I will focus on two types of indicators: momentum and oscillators. Oscillators are best suited for the “range bound” markets and momentum indicators are designed to identify strengthening trends. Yep, this question comes up many times by email, phone and at seminars. Everyone always likes to ask, which indicator is the best? Oscillators were designed to tell us when a particular market is overbought or oversold and is getting ready to reverse.
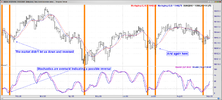
Some of the most popular oscillating indicators are Stochastics and the RSI (Relative Strength Index). I will be using Stochastic indicators for the examples. In these examples, you will see that the majority of the time when the Stochastic Oscillator drops into the oversold range, the market tends to reverse and turn upward. The flip side of this is also true. When the Stochastic rises into the overbought range, the market usually turns downward. Since this is not true in a trending market, it is important that we understand what kind of market we are looking at. Is it a range-bound market, meaning that it is not breaking new highs or new lows? Or is it a trending market that is making consistent moves in one direction or another?
Once we determine which kind of market we are dealing with, then we are better equipped to choose the indicator best suited for the situation. Let’s take the Dow Jones Industrial Average during the period shown below as an example. You can see that the DJIA was not making any significant moves one way or another, so we are using the Stochastic Oscillator to point out reversal moves. Clearly, the Stochastic Oscillator was a good choice to use for the range-bound DJIA in Mid to late 2005:
Now let’s talk about the Momentum indicators and how they are used in trending markets. of the most popular trend indicators used today are the MACD (Moving Average Convergence Divergence), and the ADX/DMI.
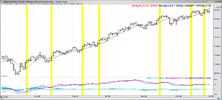
To better show how effective these can be, let’s look at the DJIA again, but this time in late 2006. It was clearly in an up trend move, but how were we supposed to know that it would continue like it did? Well we didn’t, but we could have used the MACD to confirm the strength of the trend. We are using the MACD with its Exponential Moving Average here to uncover the strength of the trend. For uptrending markets we are looking for, the MACD (the blue line on the chart below) to cross above its 9-bar exponential Moving Average (the pink line on the chart below).
When this happens, a yellow vertical Highlight Bar is drawn through the price bars. The library that you can download includes the Uptrending version of this Highlight Bar, MACD Uptrending. You can apply the Oscillentum (Oscillator and Momentum) template (also provided in the Oscillentum Library) to your chart to get a quick look at it. Keep reading for instructions on how/where you can download this library.
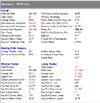
So, now that we’ve covered both types of markets and the types of indicators that you could use on them, let’s take a look at a Strategy built around these concepts. As part of the Oscillentum Library, we have included one strategy for our Platinum users, called the Underlying Momentum Strength. This quick strategy takes Long trades when the MACD is greater than its Exponential Moving Average and the MACD has crossed above its EMA in the NASDAQ Composite Index ($COMPQ).
We used the $COMPQ in this strategy to further confirm the market’s direction and strength. For exits, we used the generic Profit Target, Stop Loss rules for Long trades. Below, you can see how this simple little strategy didn’t perform too badly when trading Google (GOOGL) using the $COMPQ as the confirmation index.
You will have all the code for this strategy, so feel free to modify the library.
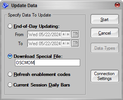
Within the Trade Navigator program, select the Blue Phone Icon to download. This brings up the download prompt. Select special file and enter the file name OSCMOM:
Follow the prompts. You will find the template and strategy added into the program.
In Conclusion
So, which indicator should you use and when should you use it? There is no black and white answer, but, using these simple rules should help you. If price is moving back and forth in a range, use and oscillator like Stochastic. If you see prices breaking out above or below previous highs and lows, moving in a fairly straight line, use momentum indicators. Will you have a possible loss when the markets change from one type to another? Yes there is a high loss, but it is better to suffer one loss vs. many from using the wrong indicator.Thank you for partnering with us!
Glen Larson
President, Genesis Financial Technologies
Attachments
- Joined
- 21 November 2022
- Posts
- 389
- Reactions
- 989
In sample tested systems are all fine and dandy but the proof of efficacy lies in out of sample testing or even better live testing , Its ridiculously easy to curve fit almost anything to fit a known fixed data set . Id love to know how this system here has gone since the dates on those charts . If you have the system parameters or code in any language i can replicate and backtest since and i am very confident it wont pumping out those numbers .Perfect indicator?
That’s what I’d like to cover this month. Is there such a thing as a perfect indicator? And if so… what is it and how do I trade with it? The answer may surprise you. Remember, there are many factors that influence the market and it’s behavior. For now, let’s put news and fundamental analysis aside and focus on market types.
There are basically two market types.
First, there are markets that move in a trading range, or that are range bound. The other is markets that are trending. Markets that are making strong moves to the upside or downside.
The astute trader quickly recognizes that no one indicator will work in both types of markets. But there are indicators that work in each type of market very well. The trouble many inexperienced trader faces is when they try to force their “favorite” indicator to work in both market types.
Since there are two types of markets, I will focus on two types of indicators: momentum and oscillators. Oscillators are best suited for the “range bound” markets and momentum indicators are designed to identify strengthening trends. Yep, this question comes up many times by email, phone and at seminars. Everyone always likes to ask, which indicator is the best? Oscillators were designed to tell us when a particular market is overbought or oversold and is getting ready to reverse.
Some of the most popular oscillating indicators are Stochastics and the RSI (Relative Strength Index). I will be using Stochastic indicators for the examples. In these examples, you will see that the majority of the time when the Stochastic Oscillator drops into the oversold range, the market tends to reverse and turn upward. The flip side of this is also true. When the Stochastic rises into the overbought range, the market usually turns downward. Since this is not true in a trending market, it is important that we understand what kind of market we are looking at. Is it a range-bound market, meaning that it is not breaking new highs or new lows? Or is it a trending market that is making consistent moves in one direction or another?
Once we determine which kind of market we are dealing with, then we are better equipped to choose the indicator best suited for the situation. Let’s take the Dow Jones Industrial Average during the period shown below as an example. You can see that the DJIA was not making any significant moves one way or another, so we are using the Stochastic Oscillator to point out reversal moves. Clearly, the Stochastic Oscillator was a good choice to use for the range-bound DJIA in Mid to late 2005:
View attachment 177489
Now let’s talk about the Momentum indicators and how they are used in trending markets. of the most popular trend indicators used today are the MACD (Moving Average Convergence Divergence), and the ADX/DMI.
To better show how effective these can be, let’s look at the DJIA again, but this time in late 2006. It was clearly in an up trend move, but how were we supposed to know that it would continue like it did? Well we didn’t, but we could have used the MACD to confirm the strength of the trend. We are using the MACD with its Exponential Moving Average here to uncover the strength of the trend. For uptrending markets we are looking for, the MACD (the blue line on the chart below) to cross above its 9-bar exponential Moving Average (the pink line on the chart below).
When this happens, a yellow vertical Highlight Bar is drawn through the price bars. The library that you can download includes the Uptrending version of this Highlight Bar, MACD Uptrending. You can apply the Oscillentum (Oscillator and Momentum) template (also provided in the Oscillentum Library) to your chart to get a quick look at it. Keep reading for instructions on how/where you can download this library.
View attachment 177490
So, now that we’ve covered both types of markets and the types of indicators that you could use on them, let’s take a look at a Strategy built around these concepts. As part of the Oscillentum Library, we have included one strategy for our Platinum users, called the Underlying Momentum Strength. This quick strategy takes Long trades when the MACD is greater than its Exponential Moving Average and the MACD has crossed above its EMA in the NASDAQ Composite Index ($COMPQ).
We used the $COMPQ in this strategy to further confirm the market’s direction and strength. For exits, we used the generic Profit Target, Stop Loss rules for Long trades. Below, you can see how this simple little strategy didn’t perform too badly when trading Google (GOOGL) using the $COMPQ as the confirmation index.
View attachment 177491
You will have all the code for this strategy, so feel free to modify the library.
Within the Trade Navigator program, select the Blue Phone Icon to download. This brings up the download prompt. Select special file and enter the file name OSCMOM:
View attachment 177492
Follow the prompts. You will find the template and strategy added into the program.
In Conclusion
So, which indicator should you use and when should you use it? There is no black and white answer, but, using these simple rules should help you. If price is moving back and forth in a range, use and oscillator like Stochastic. If you see prices breaking out above or below previous highs and lows, moving in a fairly straight line, use momentum indicators. Will you have a possible loss when the markets change from one type to another? Yes there is a high loss, but it is better to suffer one loss vs. many from using the wrong indicator.
Thank you for partnering with us!
Glen Larson
President, Genesis Financial Technologies
Edit ... Here is equity curve of some code i wrote . 25% annual return 160 trades in around 40 years 74% WR in market 27% Seems to good to be true because it is
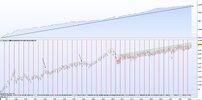
Last edited:
- Joined
- 25 July 2021
- Posts
- 910
- Reactions
- 2,327
@Chipp Perhaps I was a bit lazy when I posted this and should have added a paragraph of my own explaining the reason for the post. I copied and pasted the whole article from Glen Larson but in my mind it was simply showing people how different indicators work in different types of markets. I was not recommending a particular trading system to anyone but to be fair the article does also show people that when they develop a system of their own, they need to test it to obtain feedback about it's effectiveness.In sample tested systems are all fine and dandy but the proof of efficacy lies in out of sample testing or even better live testing , Its ridiculously easy to curve fit almost anything to fit a known fixed data set . Id love to know how this system here has gone since the dates on those charts . If you have the system parameters or code in any language i can replicate and backtest since and i am very confident it wont pumping out those numbers .
Edit ... Here is equity curve of some code i wrote . 25% annual return 160 trades in around 40 years 74% WR in market 27% Seems to good to be true because it is
View attachment 177517
- Joined
- 21 November 2022
- Posts
- 389
- Reactions
- 989
There is no perfect indicator and i would suggest the closest one to perfect is not one of the generic builtin indicators found in almost every chart platform . Of the builtins some are better than others and id go as far to say that the most popular indicators ( you know what they are ) are not amongst the best builtins , whilst ive built some profitable algos using the RSI , MACD types of the space barely one of them beats the markets by any significant % over a decade . Lag is the biggest issue along with way too many false signals . There are 2 sides to expectancy being Win Rate % and Risk/reward and whilst both are important WR is the number 1 factor in my eyes . Building systems you need to look at what is the biggest enemy ( volatility fwiw) and make a filter to actually turn that ' frightening ' thing into an asset . If you are trying to build a system that will stand the test of time and deal with most market biases/conditions you NEED some type of volatility filter/measure . Of the generic indicators i would rate ATR #1 but it is not to be used alone . 1 parameter systems will not work , you need to measure the various context of markets . But it is a diminishing return using too many parameters also . Seek the goldilocks amount and 3 is around the ideal depending on what you seek to do
- Joined
- 25 July 2021
- Posts
- 910
- Reactions
- 2,327
For people out there that are still trying to wrap their brains around trading the markets, Chip mentions a number of things, each of which should really be explained in more detail to understand where they fit into the scheme of things. For now I'll comment on (not explain in detail) two of them;There is no perfect indicator and i would suggest the closest one to perfect is not one of the generic builtin indicators found in almost every chart platform . Of the builtins some are better than others and id go as far to say that the most popular indicators ( you know what they are ) are not amongst the best builtins , whilst ive built some profitable algos using the RSI , MACD types of the space barely one of them beats the markets by any significant % over a decade . Lag is the biggest issue along with way too many false signals . There are 2 sides to expectancy being Win Rate % and Risk/reward and whilst both are important WR is the number 1 factor in my eyes . Building systems you need to look at what is the biggest enemy ( volatility fwiw) and make a filter to actually turn that ' frightening ' thing into an asset . If you are trying to build a system that will stand the test of time and deal with most market biases/conditions you NEED some type of volatility filter/measure . Of the generic indicators i would rate ATR #1 but it is not to be used alone . 1 parameter systems will not work , you need to measure the various context of markets . But it is a diminishing return using too many parameters also . Seek the goldilocks amount and 3 is around the ideal depending on what you seek to do
These metrics need to be balanced to the trading method that you decide to use.There are 2 sides to expectancy being Win Rate % and Risk/reward and whilst both are important WR is the number 1 factor in my eyes .
This is generally the case but in my opinion up to five is OK. It all depends on how you trade, no parameters can also work well and some people do only have one parameter. People using one parameter trade based on price action and have the one parameter for some additional information.1 parameter systems will not work , you need to measure the various context of markets . But it is a diminishing return using too many parameters also . Seek the goldilocks amount and 3 is around the ideal depending on what you seek to do
- Joined
- 25 July 2021
- Posts
- 910
- Reactions
- 2,327
Consistency is the hardest thing to achieve in trading, it requires a trading system with no weak spots. @Chipp has achieved it with this system. Chip can you tell us more about your system?
Similar threads
- Replies
- 11
- Views
- 3K
- Replies
- 11
- Views
- 5K


