Australian (ASX) Stock Market Forum

Learning to trade

SOMETIMES the learners are shy , unsure and uncertain , in my experience on other forums less the 10% of novices ( in general ) are brave enough to ask questions , and about half of them wait until they are in DEEP trouble ,

what most learners do not understand is , the questions they ask help ( nearly ) everybody in some way

cheers

( just because i chose not to trade , doesn't mean i am not interested in learning the basics )
 
Trading With The MACD

The MACD ( moving average convergence divergence ) indicator by Gerald Appel is a trend-following momentum indicator that uses 2 exponential moving averages to:

Give buy and sell signals

Show bullish divergence/bearish divergence

Helps determine trend direction

Some traders will also include the histogram, that will cross the zero line when the EMAs cross in either direction.

1641684825909.png

In this article, you are going to learn:

How to determine the momentum trend using the 2 line cross

How to read momentum using the fast line

The benefits of multiple time frame analysis

Always remember that a trading indicator is a derivative of price and will have some lag to current price action.

MACD Settings

The MACD default setting are: 12, 26, 9 which represents the values for:

The lookback periods for the fast line (12)

The lookback period for the slow line (26)

Signal EMA (9)

As with any trading indicator, I always start with the input parameters that were set out by the developer and later determine if I will change the values.


MACD Calculation

This leads us to how the MACD calculates its output:

The 12 period EMA calculates a number for this period

The 26 period EMA calculates a number for this period

Subtraction of the 26 EMA result from the 12 EMA result

A 9 period EMA is calculated from 26 EMA – 12 EMA

How does the indicator work?

The MACD indicator is generated by subtracting two exponential moving averages (EMAs) to create the main line (MACD line), which is then used to calculate another EMA that represents the signal line.


What is the signal line?

Signal line is a 9 EMA of MACD line. When the MACD line and signal line cross, it’s usually considered a trend reversal signals, especially when they happen away from the zero line.


MACD Settings For Intraday Trading

As with any indicator, you can change the input values depending on your needs.

Intraday traders may want a faster indicator to cut down on lag time due to their short term trading style. The search for the best settings for any indicator is a trap many of us have fallen into at least once in our trading.

You must test any changes you make to ensure it actually adds to your trading plan. Often times, a faster trading indicator will give many false signals so you must be aware of the trade-off.

That said, one very popular combination of the MACD is 3, 10, 16 which is a variation of the 3/10 oscillator.

I highly suggest that before you start crunching numbers and looking for short term macd settings for faster signals, you know exactly how the MACD works and determine if it will benefit your own trading.


What Does The MACD Measure?

The MACD line is faster than the signal line and is the result of the difference between the fast and slow EMAs.

Momentum Oscillator

When you see a signal line crossover of the faster MACD line over the signal line, we see a change in the direction of momentum.
1641684918737.png
There are traders that will use the shift in momentum as the direction they want to trade in.

Trend Direction

The signal line crossing the zero line is often used for trend direction . Traders can use the momentum aspect as a sign of a pending trend change. The zero line cross can be a confirmation of trend.

Bearish crossover – Fast MACD line crosses from above to below the slow line

Bullish crossover – Fast line crosses from below to above the slow line
1641684965429.png
Knowing that we measure trend and momentum, you may already see how we can use the MACD to actually trade with when we use both the MACD line and the signal line to alert us to a possible change in the market we are trading.

The 2 line cross can be a very powerful indicator of trading potential in the market and is my preferred approach.

Zero Line Crossover

MACD crossing above zero is considered bullish, while crossing below zero is bearish. This is also expanded to include bullish and bearish momentum when the lines cross regardless of which side of the zero line.

MACD Momentum Trading Strategy

We have set up the indicator on our chart and are going to use the standard settings as previously discussed and learn how to read the MACD.

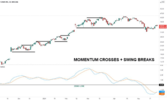
For this strategy, we are using the momentum feature of the MACD plus breaks of swing highs/low that also take place when an imbalance of buyers/sellers are present.
1641685027858.png
When we want to determine trend direction via the MACD for this strategy, we look where the MACD line is in relation to the signal line.

Strategy Details (Uptrend Example)

Mark off current swing high and low points

Price breaks swing high confirms uptrend is still in place

EMA cross on the MACD shows momentum to the upside

Use buy stop orders at high of candle that broke swing high/turned the indicator bullish via the crossing

Can we improve on this?

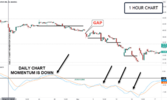
We can use multiple time frame trading by trading in the direction of the higher time frame momentum.

1641685084463.png
This is a one hour chart and the daily chart has bearish momentum. We would only trade breakdowns through support with confirmation via MACD.

If price gaps through support, we would not take the trade.

The power of this approach is we have the bearish daily chart momentum at our backs when going short on the smaller time frame.


MACD Combinations

My favorite combination of trading indicators is the MACD + Keltner channels and price action.

Keltner channels would show a market that is extended and prime for a retrace

We look for a piercing of the upper or lower Keltner channel to show extension

MACD can show loss of momentum or divergences

Keltner is set to 20 periods with a 2.25 multiplier

1641685140896.png

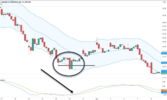
Price is making lower lows while piercing the lower Keltner channel. This is showing an extended market (oversold conditions) and while traders love to counter trend trade, we need another event to happen.


What Is a Divergence?

Divergences form when the MACD heads in one direction while price movement is in the other direction


In the black circle, we have price break lower, pierce the channel, and then we get a cross up. This cross shows momentum to the upside while price is making a lower low and is known as positive divergence.

We want to trade the reversal as this is our buy trading signal.

Entry can be a buy stop over the red candle, green candle, or a break of the small trading range.

Targets will be the middle channel line and the upper Keltner band. Trend reversals can often start from this condition so having a trading plan that includes some type of trailing stop method may be worthwhile.

Trading With The MACD – Key Takeaways

As will all technical indicators, you want to test as part of an overall trading plan that includes:

Entry and exit criteria

Risk management

Markets and timeframes you will trade

What default values are used with the MACD?

The values of 12, 26 and 9 are the typical settings used with the MACD. Other values can be substituted depending on your trading style and goals.

You may also want to experiment, as with any moving averages, consolidation plays when the 2 lines of the MACD converge. When this happens, price is usually in a range setting up a possible break out trade.

Is the MACD good for day trading?

Any indicator can be used for intraday trading and traders will often look to “tweak” default settings. Indicators will react more to faster price changes and can give more false signals.

What is a good indicator to use with MACD?

Using a moving average can be useful when looking for pullbacks after MACD makes a new momentum high or low. Also consider using price structure zones of support and resistance as well as Keltner Channels.

Is the MACD reliable?

I have found the MACD to be reliable when looking at negative and positive divergence plays. Price action always dictates if I take a trade and not the indicator itself.
 
To be honest anything that has past history as it’s basis for calculation is at best curiosity value.

its application in real time is far more challenging than showing how 200 points of data is charted in hindsite.

Charting to me is a book with chapters but chapters that can be read and ANTICIPATED going forward. To the degree that we can confidently use the book of each chart as a profitable trading tool

you’ve gone to a lot of effort and thank you for taking the time
For newbies practical application in real-time both winning and losing examples I think could be of great help

eg how to apply MACD and how to handle risk and reward

just an idea .
 

How to Earn More and Risk Less

By Tim FortierFebruary 17, 2022

There’s an important concept that when correctly implemented can almost assure your investing success.

shutterstock_2017914824-300x240.jpg
Get this wrong – and most investors do – and you could be doomed to financial ruin.

Asymmetric investing is the concept of investing where the probability or outcome of a trade has more profit than loss (or the risk taken to achieve the profit).

Said another way, the upside profit potential is greater than the downside loss possibility.

Let me first demonstrate what is NOT an example…

Buying and holding the S&P 500.

Investing in the S&P 500 has had a historic annualized return of 10.5% since 1957.

In the same period, the worst drawdown has been -55% which occurred between November 2007 and March 2009.

The potential of losing 5X–8X your potential return is NOT positive asymmetry, yet investors make this trade all the time when buying and holding index and mutual funds in their 401(k).

Losses themselves are asymmetric.

  • A 20% loss requires a 25% gain to get back to even.
  • A 50% loss requires a 100% gain to get back to even.
Investors who suffer large losses miss out on the magic of compound returns.

Compounding works only if the return stream is consistent and losses are kept small. You can’t spend your losses.

Asymmetric is not symmetry. Asymmetric is imbalanced: more of one, less of the other.

As investors, we want more gains. More profits. We want less loss. A lot less loss.

And the problem is that most any investment, unmanaged, is negatively asymmetric.

This leads us to…

Asymmetric Risk Management

Put simply, asymmetric risk management is the process of managing risk with the objective of creating a positive asymmetric risk/reward.

Remember I mentioned the worst drawdown in modern history for the S&P 500 occurred in the period between the end of 2007 and 2009?

For many investors, this is a painful memory. Let’s see if we can produce a better outcome through risk management.

In the whitepaper A Quantitative Approach to Tactical Asset Allocation by Meb Faber, the author presents a simple approach of using the 10-month moving average to help improve the performance of a basket of broad asset classes.

The idea is simple enough – own the investment any month in which the closing price of the previous month is greater than the moving average price. If the price is less than the moving average, then the investment is sold and the money is held as cash.

The reason this works is that it puts a line in the sand. It creates a level where downside risk is contained.

Every large loss began with a small loss. The moving average defines where to cut bait and move on.

For our demonstration, let’s apply the 8-month moving average (I find it works better). Our rule is that we will buy and hold the S&P 500 SPDR (SPY) as long as its price remains above the 8-month simple moving average.

Let’s see what happens.


adapt-02.17-1.png

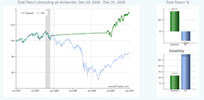
By applying a simple risk management rule, our losing investment into the SPY has been turned into an investment with positive asymmetry.

The return is positive vs. a negative return for buying and holding SPY. More importantly, the maximum drawdown is only -9.9% vs. -55.2%.


adapt-02.17-2.png

That is an 82% reduction in risk with a higher return!

Yes, you can earn more and risk less when you invest using positive asymmetry.

And this all happened because of the use of a simple rule that sold SPY on November 30, 2007, and held cash until May 29, 2009, where the strategy went long SPY for the duration of our testing period.

“The essence of investment management is the management of risks, not the management of returns.” – Legendary investor, Benjamin Graham

There are many tools that can be used to create positive asymmetry. We’ll discuss them further in future articles.

For now, remember that long-term, lasting success as an investor is not about having the highest returns. Rather, it’s about investing where risks are managed so that the opportunity for gain exceeds the potential for loss.
 
For beginning traders, (not investors,) it's probably best to learn how to read charts. This is very much an art than science.

Indicators are only meant to assist chart reading, not replacement. They have limitations and can only be used correctly within the framework of chart structure.

In old days, people drew charts by hand. Doing it bar by bar, they got the feel about the price movement, ie. the strength of the move and sentiment of the market. We don't hand draw charts nowadays because of the computer. It's tedious and time consuming too.

What I've found that works for me is to sketch the charts with a screen marker. This gives me the feel about the price moment too but more efficient than drawing charts by hand.

I use Zen trading method which centers around trading ranges. I depict chart accordingly to perceive likely opportunities or traps.

FMG for example.

fmg.png
 
Hi stanwell,

I can see from reading your post that you have a lot to learn so you have a long way to go in your journey. I'm sorry that you didn't get more out of my previous post but I've come to realize that learners only get the right messages when they have reached a point when they are ready to receive them. I was the same when starting out, I've had a number of times when the penny dropped and I finally understood something that I was told two years ago, back then I thought I knew what they told me and it was something that I kind of already knew.
I don't think that I have the teaching skills to get through to people in those early stages but I'll just put some things out there so that people that read it at the right point in their personal journey will get something out of it. Thanks for putting yourself out there and posting, maybe your example will encourage others.
I do indeed have a lot to learn. Thanks for pointing out.

It's a good thread you started, hopefully more people can get something out of it.
 
I'm going to try something on this thread, questions and answers. Anyone that has a question can post here and anyone on the forum can answer it. It's OK if multiple people answer, the asker of the question and everyone else can see the differences in the answers between people with different trading methods. I think it would best to restrict the questions at first to the more straightforward type of question, a complex question may too hard to answer with text.
 
Questions

Why are there mountains of examples which are shown in hindsight and virtually NOTHING shown in real-time?

Why are most of what I see just cut and paste commonly accepted principles (No edge).

Why don't more people get involved in the very few Real-time threads put up by Pete 2
You'll learn more off of Pete's threads than 10 years trolling the net.
It sounds like you may think that this thread is not worthwhile and you may be right. I haven't had much positive feedback about it, the question & answer thing is my latest attempt (probably my last) to see if I can turn it around.
 
Dave

My questions are genuine and not an attempt to de rail or debunk.

Technical Analysis gets a bum wrap often likened to Voodoo and I must admit most of what Ive seen over 30 years tends to fall neatly in that category.

I've seen long bouts (Years ) of Gann, Elliot, VSA, Multiple Moving Averages , Staedlmayer, Point and figure. There are points of interest in all----- but in the end, they tend to die a natural death as there are volumes on theory and Nothing of PRACTICAL Application. (Putting it to work in a consistently profitable trading plan.)

A very few of us develop our own use of a myriad of technical analysis rules and theories into our own APPLICATION.

Truth is the use of standard technical analysis used as a stand-alone trading method will see most people fail and a very few outperform the Index. If it was that easy the buildings full of Quants would be consistently returning over 10% for our Managed Funds.

The beauty in T/A to me is it CAN tell me what's happening now and why
and it can have me anticipating what is likely to be happening very soon.

Not only that it can scream at me that I'm WRONG in real-time and I can do something about it in real-time.

Unfortunately, you need to know what you DONT need to know to
Know what it is that you do need to know!
 
Unfortunately, you need to know what you DONT need to know to
Know what it is that you do need to know!
Tech I can see what you are trying to say, it's the reason why learning to trade successfully is so hard to do and yes many fail. I've tried to express this before in this thread when I said in an earlier post, "It’s your understanding that makes the money not the things you learn about."

And the point you raised about watching someone trade in real-time, following the decisions that they make as they go through the trading process, yes that is a golden opportunity for someone wanting to learn that style of trading. There are many very different styles of trading, even long term investing is one style of trading the markets. I had the idea that this thread could be a place to help people find their style, to discover the direction that they want to focus on.

Like finding your way in life, some people know early what they want to do and just start doing it, others may take a very long time before they find something that feels right to them and therefore allows success to come easier for them.

I'm not trying to make this thread the one place where learners should go, no just a place that may fill in some gaps in understanding or flick the switch that turns on the light coming from another thread on this forum.
 
Dave

I see what you have in mind.
I'll throw in the odd question if it goes quiet.

Are you covering Fundamentals as well?

If so
Fundamentally how do you determine when an investment is no longer a sound investment proposition?
How do you handle the lag between reporting and actual stock performance? The performance both positive
and negative tends to lag price action leading sometimes too large gaps up and down!
 
Are you covering Fundamentals as well?
Yes any trading question.

Fundamentally how do you determine when an investment is no longer a sound investment proposition?
How do you handle the lag between reporting and actual stock performance? The performance both positive
and negative tends to lag price action leading sometimes too large gaps up and down!
Someone else will have to answer this one, I only use fundamentals as a part of the environment I'm trading in. A current example for me would be 'rising interest rates'.
 
Dave

Rising interest rates can you outline how this affects positions your in and or positions you may be in in the future .
 
Dave

Rising interest rates can you outline how this affects positions your in and or positions you may be in in the future .
Tech I find it hard to believe that someone with your experience does not know this, I get the feeling that you may be asking me a question that you already know the answer too and I’m wondering why you are doing this.

I don’t want the mood of this thread to be one where people may feel put off from posting fearing that they will be targeted with rapid fire questions like from an automatic weapon. I would rather have a friendly environment of open discussion.

If you genuinely do not know how interest rates influence groupings of stocks then please let me know and I will explain.
 
Not for me Dave
For those who don’t ask the obvious question
A conversation point not a confrontational
Jibe. Some would see it as a silly question
So I’m asking you your view Or take
 
I haven't had much success with this thread but I did start to talk about moving averages previously so I copied this from the NetPicks website; (there also has been some discussion on MAs from Skate on his 'Dump it here' thread)

Simple Or Exponential Moving Average?

With so many technical indicators to choose from, there is always the question of the best ones to use. In fact, the question of using a Simple Moving Average Or Exponential Moving Average, is a common one. It gets worse when asking about best settings because traders are always looking for an edge.

While both EMA and SMA are useful in showing the average of price data over a fixed period, we are going to answer the questions:

Which moving average is better? What is the best setting for easy gains? Does it even make a difference?

Simple Vs Exponential Moving Averages – Overview


All things being equal, the main difference between the SMA and EMA is the calculation which influences how they react to price.


1647657537954.png

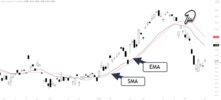
The simple moving average calculation is a standard average of N periods. Each price plot is given the same weight in the calculation and you get a true average price for whatever lookback period you have chosen. The SMA tends to be slower in reacting to price movements including sudden spikes in price. The SMA tracks further away from the price bars in a trending market compared to the EMA.

The exponential moving average formula contains a weighting factor for the most recent price plots. This weighting makes the EMA quicker to respond to sudden price spikes. Because of the faster response to changes in recent price, the EMA will track closer to price. Keep in mind that when using an indicator for trading decisions, the faster it reacts to current prices, the more chance of getting a false signal occurs.

Consolidations

One important area to note is on the left of the chart. As moving averages are averages of price using the closing price, when markets begin to consolidate and closing prices are closer to each other, price will whip around the moving average. For breakout traders, a quick scan using a moving average can give you a list of instruments in a consolidation.

Another area is on the right with the pointer. The gap down is a good example of how the EMA reacted faster than the SMA to price movement. While the SMA kept climbing, the EMA reversed direction to the downside and as mentioned, this is due to the most recent data having more meaning in the calculation than the previous data.

For the most part and during a steady move, there is very little difference between the two moving averages at the same lookback period.

Do Larger Time Periods Make A Difference?

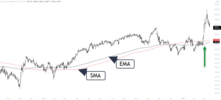
The last example used one of the more popular settings of 20. If we go out to a common trend following period of the 200-Day SMA and EMA, is there a difference?

1647657640864.png

Regardless of how you use moving averages for your trading, would you do anything differently with either of these averages? Probably not. The green arrow does show where the EMA reacted to the large move however it didn’t add any useful information to any strategy that I can think of.

Trading Approaches

There are many ways a trader will use a moving average in their trading strategies and personally, price action plays a bigger part in my own trading. The average is just to help frame the market and no trading decision is made based on the average itself.

To help determine whether you should use an EMA or SMA, let’s look at determining the trend with a price cross and trading a pullback to around the average.

1647657740829.png

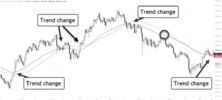
If we consider the trend changes with price crossing an average, it makes little if any difference to bias. In fact, in the middle of the chart, a double top formation and price direction breakdown gives a trend change faster than either average.

With pullbacks to an area around the averages, the only issue is the black circle where it doesn’t touch either average. For most traders, close is close enough and price action, where price ranged and broke down, is enough for a short trade.

Which Moving Average To Use

The difference between the EMA and SMA is minimal and should not make much of a difference in a robust trading strategy. In regards to best settings, just like the type, there is no best setting.

Short term traders who enjoy faster indicator movements as part of their strategy, may opt for a 10-day EMA or SMA. A trader may be looking for a short term consolidation and will use price hugging the 10 period SMA as a trigger to start looking for a breakout trade.

Longer-term traders who don’t care for more responsive indicators may choose a 50-200 period SMA for a trend indicator. As we saw in comparing the 200 EMA and SMA, being more responsive with the EMA made little difference.

You could even use something like the 100 SMA for longer term trend direction and a 10 EMA for corrections against the main trend.

1647657797722.png

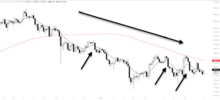
Using a recent chart of Bitcoin, the 100 SMA is showing a downtrend trend as price is trading below it.

Price rallies above the faster 10 EMA and upon a close below the average, a trader could sell. This is not a trading strategy you should start trading without some testing. You need to determine how much price action is needed on the opposite side of the EMA. Is a close below enough for a trade entry or do you need the whole candle?

Bottom Line

There is no best moving average or best period setting. Want quicker action for some reason? Use a shorter period moving average but be aware of false signals.

Do you just prefer to see price smoothed on your chart for a birds eye view of the market? Use a 20,50,200 SMA.

In the end, a robust trading strategy should not depend on either the type of moving average or slight variations in period settings. We are simply looking at an average of closing prices, generally, over a period of time. That period of time can be a short period of 20 or long periods of 100+.

It is what you do with that information that matters.
 
Top